PG&E 2013 Annual Report Download - page 98
Download and view the complete annual report
Please find page 98 of the 2013 PG&E annual report below. You can navigate through the pages in the report by either clicking on the pages listed below, or by using the keyword search tool below to find specific information within the annual report.-
 1
1 -
2
-
3
-
4
-
5
-
6
-
7
-
8
-
9
-
10
-
11
-
12
-
13
-
14
-
15
-
16
-
17
-
18
-
19
-
20
-
21
-
22
-
23
-
24
-
25
-
26
-
27
-
28
-
29
-
30
-
31
-
32
-
33
-
34
-
35
-
36
-
37
-
38
-
39
-
40
-
41
-
42
-
43
-
44
-
45
-
46
-
47
-
48
-
49
-
50
-
51
-
52
-
53
-
54
-
55
-
56
-
57
-
58
-
59
-
60
-
61
-
62
-
63
-
64
-
65
-
66
-
67
-
68
-
69
-
70
-
71
-
72
-
73
-
74
-
75
-
76
-
77
-
78
-
79
-
80
-
81
-
82
-
83
-
84
-
85
-
86
-
87
-
 88
88 -
 89
89 -
 90
90 -
 91
91 -
 92
92 -
 93
93 -
 94
94 -
 95
95 -
 96
96 -
 97
97 -
 98
98 -
 99
99 -
 100
100 -
 101
101 -
 102
102 -
 103
103 -
 104
104 -
 105
105 -
 106
106 -
 107
107 -
 108
108 -
109
-
110
-
111
-
112
-
113
-
114
-
115
-
116
-
117
-
118
-
119
-
120
 |
 |

NOTES TO THE CONSOLIDATED FINANCIAL STATEMENTS (Continued)
NOTE 11: EMPLOYEE BENEFIT PLANS (Continued)
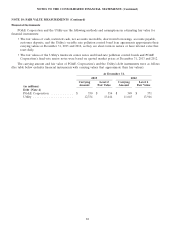
Other fixed-income primarily includes pass-through and asset-backed securities. Pass-through securities are
valued based on benchmark yields created using observable market inputs and are Level 2 assets. Asset-backed
securities are primarily valued based on broker quotes and are considered Level 2 assets. Other fixed-income also
includes municipal bonds and index futures. Collateral posted related to the index futures consist of money market
investments that are considered Level 1 assets. Municipal bonds are valued based on a compilation of primarily
observable information or broker quotes in non-active markets and are considered Level 2 assets. Futures are valued
based on unadjusted prices in active markets and are Level 1 assets.
Transfers Between Levels
Any transfers between levels in the fair value hierarchy are recognized as of the end of the reporting period. No
significant transfers between levels occurred in the years ended December 31, 2013 and 2012.
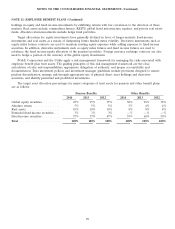
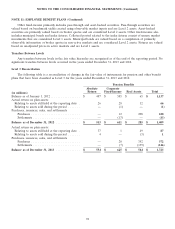
Level 3 Reconciliation
The following table is a reconciliation of changes in the fair value of instruments for pension and other benefit
plans that have been classified as Level 3 for the years ended December 31, 2013 and 2012:
Pension Benefits
Absolute Corporate
Return Fixed-Income Real Assets Total
(in millions)
Balance as of January 1, 2012 ................. $ 487 $ 585 $ 65 $ 1,137
Actual return on plan assets:
Relating to assets still held at the reporting date . 26 28 12 66
Relating to assets sold during the period ....... — (1) — (1)
Purchases, issuances, sales, and settlements
Purchases ............................ — 12 208 220
Settlements ........................... — (13) — (13)
Balance as of December 31, 2012 .............. $ 513 $ 611 $ 285 $ 1,409
Actual return on plan assets:
Relating to assets still held at the reporting date . 37 1 49 87
Relating to assets sold during the period ....... 4 — (3) 1
Purchases, issuances, sales, and settlements
Purchases ............................ — 20 352 372
Settlements ........................... — (7) (139) (146)
Balance as of December 31, 2013 .............. $ 554 $ 625 $ 544 $ 1,723
92