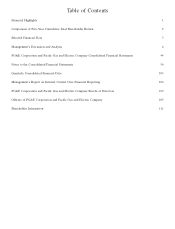
PG&E 2013 Annual Report Download - page 9
Download and view the complete annual report
Please find page 9 of the 2013 PG&E annual report below. You can navigate through the pages in the report by either clicking on the pages listed below, or by using the keyword search tool below to find specific information within the annual report.-
 1
1 -
 2
2 -
 3
3 -
 4
4 -
 5
5 -
 6
6 -
 7
7 -
 8
8 -
 9
9 -
 10
10 -
 11
11 -
 12
12 -
 13
13 -
 14
14 -
 15
15 -
 16
16 -
 17
17 -
 18
18 -
 19
19 -
 20
20 -
21
-
22
-
23
-
24
-
25
-
26
-
27
-
28
-
29
-
30
-
31
-
32
-
33
-
34
-
35
-
36
-
37
-
38
-
39
-
40
-
41
-
42
-
43
-
44
-
45
-
46
-
47
-
48
-
49
-
50
-
51
-
52
-
53
-
54
-
55
-
56
-
57
-
58
-
59
-
60
-
61
-
62
-
63
-
64
-
65
-
66
-
67
-
68
-
69
-
70
-
71
-
72
-
73
-
74
-
75
-
76
-
77
-
78
-
79
-
80
-
81
-
82
-
83
-
84
-
85
-
86
-
87
-
88
-
89
-
90
-
91
-
92
-
93
-
94
-
95
-
96
-
97
-
98
-
99
-
100
-
101
-
102
-
103
-
104
-
105
-
106
-
107
-
108
-
109
-
110
-
111
-
112
-
113
-
114
-
115
-
116
-
117
-
118
-
119
-
120
 |
 |

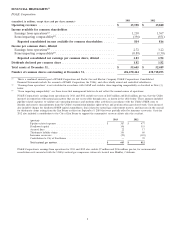
SELECTED FINANCIAL DATA
2013 2012 2011 2010 2009
(in millions, except per share amounts)
PG&E Corporation
For the Year
Operating revenues ................ $ 15,598 $ 15,040 $ 14,956 $ 13,841 $ 13,399
Operating income ................. 1,762 1,693 1,942 2,308 2,299
Income from continuing operations .... 828 830 858 1,113 1,234
Earnings per common share from
continuing operations, basic ........ 1.83 1.92 2.10 2.86 3.25
Earnings per common share from
continuing operations, diluted ....... 1.83 1.92 2.10 2.82 3.20
Dividends declared per common share(1) . 1.82 1.82 1.82 1.82 1.68
At Year-End
Common stock price per share ........ $ 40.28 $ 40.18 $ 41.22 $ 47.84 $ 44.65
Total assets ...................... 55,605 52,449 49,750 46,025 42,945
Long-term debt (excluding current
portion) ...................... 12,717 12,517 11,766 10,906 10,381
Capital lease obligations (excluding
current portion)(2) ............... 90 113 212 248 282
Energy recovery bonds (excluding
current portion)(3) ...............———423827
Pacific Gas and Electric Company
For the Year
Operating revenues ................ $ 15,593 $ 15,035 $ 14,951 $ 13,840 $ 13,399
Operating income ................. 1,790 1,695 1,944 2,314 2,302
Income available for common stock .... 852 797 831 1,107 1,236
At Year-End
Total assets ...................... 55,049 51,923 49,242 45,679 42,709
Long-term debt (excluding current
portion) ...................... 12,717 12,167 11,417 10,557 10,033
Capital lease obligations (excluding
current portion)(2) ............... 90 113 212 248 282
Energy recovery bonds (excluding
current portion)(3) ...............———423827
(1) Information about the frequency and amount of dividends and restrictions on the payment of dividends is set forth in ‘‘Liquidity and
Financial Resources—Dividends’’ within ‘‘Management’s Discussion and Analysis of Financial Condition and Results of Operations,’’ and in
PG&E Corporation’s Consolidated Statements of Equity, the Utility’s Consolidated Statements of Shareholders’ Equity, and Note 5 of the
Notes to the Consolidated Financial Statements.
(2) The capital lease obligations amounts are included in noncurrent liabilities—other in PG&E Corporation’s and the Utility’s Consolidated
Balance Sheets.
(3) The energy recovery bonds matured in December 2012.
3