PG&E 2013 Annual Report Download - page 22
Download and view the complete annual report
Please find page 22 of the 2013 PG&E annual report below. You can navigate through the pages in the report by either clicking on the pages listed below, or by using the keyword search tool below to find specific information within the annual report.-
 1
1 -
2
-
3
-
4
-
5
-
6
-
7
-
8
-
9
-
10
-
11
-
 12
12 -
 13
13 -
 14
14 -
 15
15 -
 16
16 -
 17
17 -
 18
18 -
 19
19 -
 20
20 -
 21
21 -
 22
22 -
 23
23 -
 24
24 -
 25
25 -
 26
26 -
 27
27 -
 28
28 -
 29
29 -
 30
30 -
 31
31 -
 32
32 -
33
-
34
-
35
-
36
-
37
-
38
-
39
-
40
-
41
-
42
-
43
-
44
-
45
-
46
-
47
-
48
-
49
-
50
-
51
-
52
-
53
-
54
-
55
-
56
-
57
-
58
-
59
-
60
-
61
-
62
-
63
-
64
-
65
-
66
-
67
-
68
-
69
-
70
-
71
-
72
-
73
-
74
-
75
-
76
-
77
-
78
-
79
-
80
-
81
-
82
-
83
-
84
-
85
-
86
-
87
-
88
-
89
-
90
-
91
-
92
-
93
-
94
-
95
-
96
-
97
-
98
-
99
-
100
-
101
-
102
-
103
-
104
-
105
-
106
-
107
-
108
-
109
-
110
-
111
-
112
-
113
-
114
-
115
-
116
-
117
-
118
-
119
-
120
 |
 |

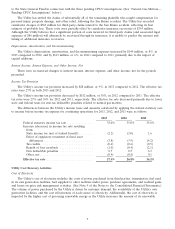
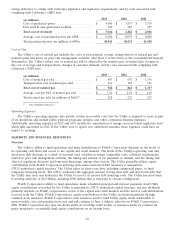
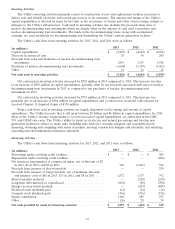
In 2013, net cash provided by financing activities increased by $2.0 billion compared to the same period in 2012.
In 2012, net cash provided by financing activities decreased by $773 million compared to 2011. Cash provided by or
used in financing activities is driven by the Utility’s financing needs, which depend on the level of cash provided by
or used in operating activities, the level of cash provided by or used in investing activities, the conditions in the
capital markets, and the maturity date of existing debt instruments. The Utility generally utilizes long-term senior
unsecured debt issuances and equity contributions from PG&E Corporation to maintain its CPUC-authorized capital
structure, and relies on short-term debt to fund temporary financing needs.
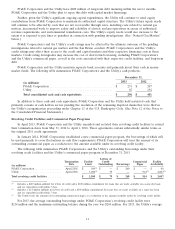
PG&E Corporation
PG&E Corporation affiliates hold four tax equity agreements to fund residential and commercial retail solar
energy installations with four separate privately held funds that are considered VIEs. Under these agreements,
PG&E Corporation has made cumulative lease payments and investment contributions of $362 million and received
$275 million in benefits and customer payments from 2010 to 2013. PG&E Corporation has no material remaining
commitment to fund these agreements. Lease payments, investment contributions, benefits, and customer payments
received are included in cash flows from operating and investing activities within the Consolidated Statements of
Cash Flows.
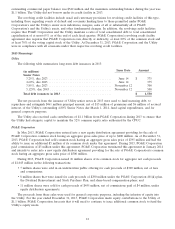
In addition to the investments above, PG&E Corporation had the following material cash flows on a stand-alone
basis for the years ended December 31, 2013, 2012, and 2011: dividend payments, common stock issuances,
borrowings and repayments under its revolving credit facility, and transactions between PG&E Corporation and the
Utility.
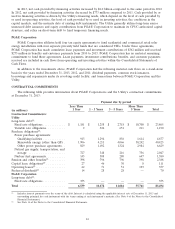
CONTRACTUAL COMMITMENTS
The following table provides information about PG&E Corporation’s and the Utility’s contractual commitments
at December 31, 2013:
Payment due by period
Less Than More Than
1 Year 1 - 3 Years 3 - 5 Years 5 Years Total
(in millions)
Contractual Commitments:
Utility
Long-term debt(1):
Fixed rate obligations ............. $ 1,181 $ 1,258 $ 2,718 $ 18,708 $ 23,865
Variable rate obligations ........... 2 326 651 211 1,190
Purchase obligations(2):
Power purchase agreements:
Qualifying facilities ............. 913 1,294 856 1,614 4,677
Renewable energy (other than QF) . 1,906 4,211 4,066 30,242 40,425
Other power purchase agreements . . 829 1,492 1,324 2,984 6,629
Natural gas supply, transportation, and
storage ..................... 727 348 216 756 2,047
Nuclear fuel agreements ........... 145 308 280 647 1,380
Pension and other benefits(3) ......... 398 796 796 398 2,388
Capital lease obligations(2) ........... 27 46 30 8 111
Operating leases(2) ................. 42 71 51 193 357
Preferred dividends(4) .............. 14 28 28 — 70
PG&E Corporation
Long-term debt(1):
Fixed rate obligations ............. 355 — — — 355
Total .......................... 6,539 10,178 11,016 55,761 83,494
(1) Includes interest payments over the terms of the debt. Interest is calculated using the applicable interest rate at December 31, 2013 and
outstanding principal for each instrument with the terms ending at each instrument’s maturity. (See Note 4 of the Notes to the Consolidated
Financial Statements.)
(2) See Note 14 of the Notes to the Consolidated Financial Statements.
16