PG&E 2013 Annual Report Download - page 58
Download and view the complete annual report
Please find page 58 of the 2013 PG&E annual report below. You can navigate through the pages in the report by either clicking on the pages listed below, or by using the keyword search tool below to find specific information within the annual report.-
 1
1 -
2
-
3
-
4
-
5
-
6
-
7
-
8
-
9
-
10
-
11
-
12
-
13
-
14
-
15
-
16
-
17
-
18
-
19
-
20
-
21
-
22
-
23
-
24
-
25
-
26
-
27
-
28
-
29
-
30
-
31
-
32
-
33
-
34
-
35
-
36
-
37
-
38
-
39
-
40
-
41
-
42
-
43
-
44
-
45
-
46
-
47
-
 48
48 -
 49
49 -
 50
50 -
 51
51 -
 52
52 -
 53
53 -
 54
54 -
 55
55 -
 56
56 -
 57
57 -
 58
58 -
 59
59 -
 60
60 -
 61
61 -
 62
62 -
 63
63 -
 64
64 -
 65
65 -
 66
66 -
 67
67 -
 68
68 -
69
-
70
-
71
-
72
-
73
-
74
-
75
-
76
-
77
-
78
-
79
-
80
-
81
-
82
-
83
-
84
-
85
-
86
-
87
-
88
-
89
-
90
-
91
-
92
-
93
-
94
-
95
-
96
-
97
-
98
-
99
-
100
-
101
-
102
-
103
-
104
-
105
-
106
-
107
-
108
-
109
-
110
-
111
-
112
-
113
-
114
-
115
-
116
-
117
-
118
-
119
-
120
 |
 |

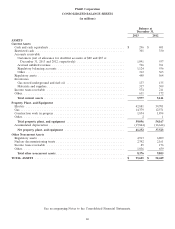
Pacific Gas and Electric Company
CONSOLIDATED BALANCE SHEETS
(in millions)
Balance at December 31,
2013 2012
ASSETS
Current Assets
Cash and cash equivalents ......................................... $ 65 $ 194
Restricted cash ................................................. 301 330
Accounts receivable
Customers (net of allowance for doubtful accounts of $80 and $87 at
December 31, 2013 and 2012, respectively) .......................... 1,091 937
Accrued unbilled revenue ........................................ 766 761
Regulatory balancing accounts .................................... 1,124 936
Other ...................................................... 313 366
Regulatory assets ................................................ 448 564
Inventories
Gas stored underground and fuel oil ................................ 137 135
Materials and supplies .......................................... 317 309
Income taxes receivable ........................................... 563 186
Other ........................................................ 523 160
Total current assets ............................................ 5,648 4,878
Property, Plant, and Equipment
Electric ....................................................... 42,881 39,701
Gas ......................................................... 14,379 12,571
Construction work in progress ...................................... 1,834 1,894
Total property, plant, and equipment ................................ 59,094 54,166
Accumulated depreciation ......................................... (17,843) (16,643)
Net property, plant, and equipment ................................. 41,251 37,523
Other Noncurrent Assets
Regulatory assets ................................................ 4,913 6,809
Nuclear decommissioning trusts ..................................... 2,342 2,161
Income taxes receivable ........................................... 81 171
Other ........................................................ 814 381
Total other noncurrent assets ..................................... 8,150 9,522
TOTAL ASSETS .................................................. $ 55,049 $ 51,923
See accompanying Notes to the Consolidated Financial Statements.
52