PG&E 2013 Annual Report Download - page 85
Download and view the complete annual report
Please find page 85 of the 2013 PG&E annual report below. You can navigate through the pages in the report by either clicking on the pages listed below, or by using the keyword search tool below to find specific information within the annual report.-
 1
1 -
2
-
3
-
4
-
5
-
6
-
7
-
8
-
9
-
10
-
11
-
12
-
13
-
14
-
15
-
16
-
17
-
18
-
19
-
20
-
21
-
22
-
23
-
24
-
25
-
26
-
27
-
28
-
29
-
30
-
31
-
32
-
33
-
34
-
35
-
36
-
37
-
38
-
39
-
40
-
41
-
42
-
43
-
44
-
45
-
46
-
47
-
48
-
49
-
50
-
51
-
52
-
53
-
54
-
55
-
56
-
57
-
58
-
59
-
60
-
61
-
62
-
63
-
64
-
65
-
66
-
67
-
68
-
69
-
70
-
71
-
72
-
73
-
74
-
 75
75 -
 76
76 -
 77
77 -
 78
78 -
 79
79 -
 80
80 -
 81
81 -
 82
82 -
 83
83 -
 84
84 -
 85
85 -
 86
86 -
 87
87 -
 88
88 -
 89
89 -
 90
90 -
 91
91 -
 92
92 -
 93
93 -
 94
94 -
 95
95 -
96
-
97
-
98
-
99
-
100
-
101
-
102
-
103
-
104
-
105
-
106
-
107
-
108
-
109
-
110
-
111
-
112
-
113
-
114
-
115
-
116
-
117
-
118
-
119
-
120
 |
 |

NOTES TO THE CONSOLIDATED FINANCIAL STATEMENTS (Continued)
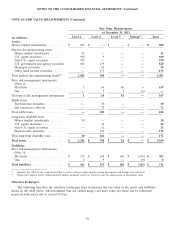
NOTE 10: FAIR VALUE MEASUREMENTS (Continued)
Fair Value Measurements
At December 31, 2012
Level 1 Level 2 Level 3 Netting(1) Total
(in millions)
Assets:
Money market investments .......... $ 209 $ — $ — $ — $ 209
Nuclear decommissioning trusts
Money market investments ......... 21———21
U.S. equity securities ............. 940 9 — — 949
Non-U.S. equity securities ......... 379 — — — 379
U.S. government and agency securities 681 139 — — 820
Municipal securities .............. — 59 — — 59
Other fixed-income securities ....... — 173 — — 173
Total nuclear decommissioning trusts(2) .. 2,021 380 — — 2,401
Price risk management instruments
(Note 9)
Electricity ..................... 1 60 80 6 147
Gas ......................... — 5 1 (6) —
Total price risk management instruments 16581—147
Rabbi trusts
Fixed-income securities ........... — 30 — — 30
Life insurance contracts ........... — 72 — — 72
Total rabbi trusts .................. — 102 — — 102
Long-term disability trust
Money market investments ......... 10———10
U.S. equity securities ............. — 14 — — 14
Non-U.S. equity securities ......... — 11 — — 11
Fixed-income securities ........... — 136 — — 136
Total long-term disability trust ........ 10 161 — — 171
Total assets ..................... $ 2,241 $ 708 $ 81 $ — $ 3,030
Liabilities:
Price risk management instruments
(Note 9)
Electricity ..................... $ 155 $ 144 $ 160 $ (156) $ 303
Gas ......................... 8 9 — (9) 8
Total liabilities ................... $ 163 $ 153 $ 160 $ (165) $ 311
(1) Includes the effect of the contractual ability to settle contracts under master netting agreements and margin cash collateral.
(2) Represents amount before deducting $240 million, primarily related to deferred taxes on appreciation of investment value.
Valuation Techniques
The following describes the valuation techniques used to measure the fair value of the assets and liabilities
shown in the table above. All investments that are valued using a net asset value per share can be redeemed
quarterly with notice not to exceed 90 days.
79