PG&E 2013 Annual Report Download - page 20
Download and view the complete annual report
Please find page 20 of the 2013 PG&E annual report below. You can navigate through the pages in the report by either clicking on the pages listed below, or by using the keyword search tool below to find specific information within the annual report.-
 1
1 -
2
-
3
-
4
-
5
-
6
-
7
-
8
-
9
-
 10
10 -
 11
11 -
 12
12 -
 13
13 -
 14
14 -
 15
15 -
 16
16 -
 17
17 -
 18
18 -
 19
19 -
 20
20 -
 21
21 -
 22
22 -
 23
23 -
 24
24 -
 25
25 -
 26
26 -
 27
27 -
 28
28 -
 29
29 -
 30
30 -
31
-
32
-
33
-
34
-
35
-
36
-
37
-
38
-
39
-
40
-
41
-
42
-
43
-
44
-
45
-
46
-
47
-
48
-
49
-
50
-
51
-
52
-
53
-
54
-
55
-
56
-
57
-
58
-
59
-
60
-
61
-
62
-
63
-
64
-
65
-
66
-
67
-
68
-
69
-
70
-
71
-
72
-
73
-
74
-
75
-
76
-
77
-
78
-
79
-
80
-
81
-
82
-
83
-
84
-
85
-
86
-
87
-
88
-
89
-
90
-
91
-
92
-
93
-
94
-
95
-
96
-
97
-
98
-
99
-
100
-
101
-
102
-
103
-
104
-
105
-
106
-
107
-
108
-
109
-
110
-
111
-
112
-
113
-
114
-
115
-
116
-
117
-
118
-
119
-
120
 |
 |

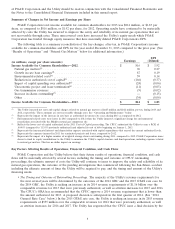
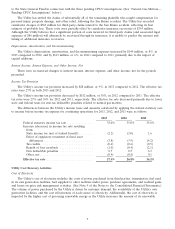
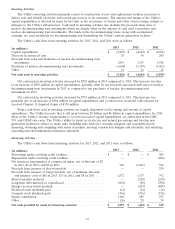
The Utility’s cash flows from operating activities for 2013, 2012, and 2011 were as follows:
2013 2012 2011
(in millions)
Net income ............................................ $ 866 $ 811 $ 845
Adjustments to reconcile net income to net cash provided by operating
activities:
Depreciation, amortization, and decommissioning ............... 2,077 2,272 2,215
Allowance for equity funds used during construction ............ (101) (107) (87)
Deferred income taxes and tax credits, net .................... 1,103 684 582
PSEP disallowed capital expenditures ....................... 196 353 —
Other .............................................. 299 236 289
Effect of changes in operating assets and liabilities:
Accounts receivable ................................... (152) (40) (227)
Inventories ......................................... (10) (24) (63)
Accounts payable .................................... 99 (26) 51
Income taxes receivable/payable .......................... (377) (50) (192)
Other current assets and liabilities ........................ (404) 272 36
Regulatory assets, liabilities, and balancing accounts, net ........ (202) 291 (100)
Other noncurrent assets and liabilities ..................... 22 256 414
Net cash provided by operating activities ...................... $ 3,416 $ 4,928 $ 3,763
During 2013, net cash provided by operating activities decreased by $1.5 billion as compared to 2012 when the
Utility collected $460 million from customers related to the energy recovery bonds which matured at the end of 2012.
In addition, in 2013, the amount of cash collateral returned to the Utility by third parties was $243 million lower
than in 2012, the settlement payments the Utility received from the U.S Treasury related to the Utility’s spent
nuclear fuel disposal costs was $221 million lower, net of legal fees, than the Utility received in 2012, and the
Utility’s tax payments were $236 million higher than in 2012. The remaining changes in cash flows from operating
activities consisted of fluctuations in activities within the normal course of business such as the timing and amount of
customer billings and collections.
During 2012, net cash provided by operating activities increased by $1.2 billion compared to 2011 when the
Utility’s net collateral payments were $352 million higher. Also, in 2012, the Utility received settlement payments of
$250 million, net of legal fees, from the U.S. Treasury related to the Utility’s spent nuclear fuel disposal costs and
made tax payments that were $224 million lower than in 2011. The remaining changes in cash flows from operating
activities consisted of fluctuations in activities within the normal course of business such as the timing and amount of
customer billings and collections.
Future cash flow from operating activities will be affected by various factors, including:
• the timing and outcome of ratemaking proceedings, including the 2014 GRC and 2015 GT&S rate cases;
• the timing and amount of tax payments, tax refunds, net collateral payments, and interest payments;
• the timing and amount of insurance recoveries related to third party claims;
• the timing and amount of fines or penalties that may be imposed, as well as any costs associated with
remedial actions the Utility may be required to implement;
• the timing and amount of costs the Utility incurs, but does not recover, to improve the safety and reliability of
its natural gas system (see ‘‘Operating and Maintenance’’ above and ‘‘Natural Gas Matters’’ below); and
• the timing of the resolution of the Chapter 11 disputed claims and the amount of interest on these claims that
the Utility will be required to pay (see Note 12 of the Notes to the Consolidated Financial Statements).
14