PG&E 2013 Annual Report Download - page 56
Download and view the complete annual report
Please find page 56 of the 2013 PG&E annual report below. You can navigate through the pages in the report by either clicking on the pages listed below, or by using the keyword search tool below to find specific information within the annual report.-
 1
1 -
2
-
3
-
4
-
5
-
6
-
7
-
8
-
9
-
10
-
11
-
12
-
13
-
14
-
15
-
16
-
17
-
18
-
19
-
20
-
21
-
22
-
23
-
24
-
25
-
26
-
27
-
28
-
29
-
30
-
31
-
32
-
33
-
34
-
35
-
36
-
37
-
38
-
39
-
40
-
41
-
42
-
43
-
44
-
45
-
 46
46 -
 47
47 -
 48
48 -
 49
49 -
 50
50 -
 51
51 -
 52
52 -
 53
53 -
 54
54 -
 55
55 -
 56
56 -
 57
57 -
 58
58 -
 59
59 -
 60
60 -
 61
61 -
 62
62 -
 63
63 -
 64
64 -
 65
65 -
 66
66 -
67
-
68
-
69
-
70
-
71
-
72
-
73
-
74
-
75
-
76
-
77
-
78
-
79
-
80
-
81
-
82
-
83
-
84
-
85
-
86
-
87
-
88
-
89
-
90
-
91
-
92
-
93
-
94
-
95
-
96
-
97
-
98
-
99
-
100
-
101
-
102
-
103
-
104
-
105
-
106
-
107
-
108
-
109
-
110
-
111
-
112
-
113
-
114
-
115
-
116
-
117
-
118
-
119
-
120
 |
 |

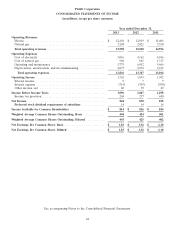
Pacific Gas and Electric Company
CONSOLIDATED STATEMENTS OF INCOME
(in millions)
Year ended December 31,
2013 2012 2011
Operating Revenues
Electric ............................................. $ 12,489 $ 12,014 $ 11,601
Natural gas .......................................... 3,104 3,021 3,350
Total operating revenues ............................... 15,593 15,035 14,951
Operating Expenses
Cost of electricity ...................................... 5,016 4,162 4,016
Cost of natural gas ..................................... 968 861 1,317
Operating and maintenance .............................. 5,742 6,045 5,459
Depreciation, amortization, and decommissioning ............... 2,077 2,272 2,215
Total operating expenses ............................... 13,803 13,340 13,007
Operating Income ....................................... 1,790 1,695 1,944
Interest income .......................................865
Interest expense ....................................... (690) (680) (677)
Other income, net ..................................... 84 88 53
Income Before Income Taxes ............................... 1,192 1,109 1,325
Income tax provision ................................... 326 298 480
Net Income ............................................ 866 811 845
Preferred stock dividend requirement ....................... 14 14 14
Income Available for Common Stock ......................... $ 852 $ 797 $ 831
See accompanying Notes to the Consolidated Financial Statements.
50