PG&E 2013 Annual Report Download - page 60
Download and view the complete annual report
Please find page 60 of the 2013 PG&E annual report below. You can navigate through the pages in the report by either clicking on the pages listed below, or by using the keyword search tool below to find specific information within the annual report.-
 1
1 -
2
-
3
-
4
-
5
-
6
-
7
-
8
-
9
-
10
-
11
-
12
-
13
-
14
-
15
-
16
-
17
-
18
-
19
-
20
-
21
-
22
-
23
-
24
-
25
-
26
-
27
-
28
-
29
-
30
-
31
-
32
-
33
-
34
-
35
-
36
-
37
-
38
-
39
-
40
-
41
-
42
-
43
-
44
-
45
-
46
-
47
-
48
-
49
-
 50
50 -
 51
51 -
 52
52 -
 53
53 -
 54
54 -
 55
55 -
 56
56 -
 57
57 -
 58
58 -
 59
59 -
 60
60 -
 61
61 -
 62
62 -
 63
63 -
 64
64 -
 65
65 -
 66
66 -
 67
67 -
 68
68 -
 69
69 -
 70
70 -
71
-
72
-
73
-
74
-
75
-
76
-
77
-
78
-
79
-
80
-
81
-
82
-
83
-
84
-
85
-
86
-
87
-
88
-
89
-
90
-
91
-
92
-
93
-
94
-
95
-
96
-
97
-
98
-
99
-
100
-
101
-
102
-
103
-
104
-
105
-
106
-
107
-
108
-
109
-
110
-
111
-
112
-
113
-
114
-
115
-
116
-
117
-
118
-
119
-
120
 |
 |

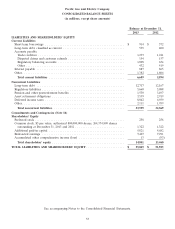
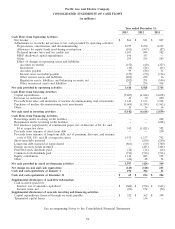
Pacific Gas and Electric Company
CONSOLIDATED STATEMENTS OF CASH FLOWS
(in millions)
Year ended December 31,
2013 2012 2011
Cash Flows from Operating Activities
Net income .................................................. $ 866 $ 811 $ 845
Adjustments to reconcile net income to net cash provided by operating activities:
Depreciation, amortization, and decommissioning ...................... 2,077 2,272 2,215
Allowance for equity funds used during construction ................... (101) (107) (87)
Deferred income taxes and tax credits, net .......................... 1,103 684 582
PSEP disallowed capital expenditures .............................. 196 353 —
Other .................................................... 299 236 289
Effect of changes in operating assets and liabilities:
Accounts receivable ......................................... (152) (40) (227)
Inventories ............................................... (10) (24) (63)
Accounts payable ........................................... 99 (26) 51
Income taxes receivable/payable ................................ (377) (50) (192)
Other current assets and liabilities ............................... (404) 272 36
Regulatory assets, liabilities, and balancing accounts, net ............... (202) 291 (100)
Other noncurrent assets and liabilities ............................ 22 256 414
Net cash provided by operating activities ............................... 3,416 4,928 3,763
Cash Flows from Investing Activities
Capital expenditures ............................................ (5,207) (4,624) (4,038)
Decrease in restricted cash ....................................... 29 50 200
Proceeds from sales and maturities of nuclear decommissioning trust investments . 1,619 1,133 1,928
Purchases of nuclear decommissioning trust investments .................. (1,604) (1,189) (1,963)
Other ...................................................... 21 16 14
Net cash used in investing activities .................................. (5,142) (4,614) (3,859)
Cash Flows from Financing Activities
Borrowings under revolving credit facilities ............................ — — 208
Repayments under revolving credit facilities ........................... — — (208)
Net issuances (repayments) of commercial paper, net of discount of $2, $3, and
$4 at respective dates ......................................... 542 (1,021) 782
Proceeds from issuance of short-term debt ............................ — — 250
Proceeds from issuance of long-term debt, net of premium, discount, and issuance
costs of $18, $13, and $8 at respective dates ......................... 1,532 1,137 792
Short-term debt matured ........................................ — (250) (250)
Long-term debt matured or repurchased ............................. (861) (50) (700)
Energy recovery bonds matured .................................... — (423) (404)
Preferred stock dividends paid ..................................... (14) (14) (14)
Common stock dividends paid ..................................... (716) (716) (716)
Equity contribution ............................................ 1,140 885 555
Other ...................................................... (26) 28 54
Net cash provided by (used in) financing activities ........................ 1,597 (424) 349
Net change in cash and cash equivalents ............................... (129) (110) 253
Cash and cash equivalents at January 1 ............................... 194 304 51
Cash and cash equivalents at December 31 ............................. $ 65 $ 194 $ 304
Supplemental disclosures of cash flow information
Cash received (paid) for:
Interest, net of amounts capitalized ............................... $ (600) $ (574) $ (627)
Income taxes, net ............................................ (62) 174 (50)
Supplemental disclosures of noncash investing and financing activities
Capital expenditures financed through accounts payable ................... $ 322 $ 362 $ 308
Terminated capital leases ........................................ — 136 —
See accompanying Notes to the Consolidated Financial Statements.
54