PG&E 2013 Annual Report Download - page 78
Download and view the complete annual report
Please find page 78 of the 2013 PG&E annual report below. You can navigate through the pages in the report by either clicking on the pages listed below, or by using the keyword search tool below to find specific information within the annual report.-
 1
1 -
2
-
3
-
4
-
5
-
6
-
7
-
8
-
9
-
10
-
11
-
12
-
13
-
14
-
15
-
16
-
17
-
18
-
19
-
20
-
21
-
22
-
23
-
24
-
25
-
26
-
27
-
28
-
29
-
30
-
31
-
32
-
33
-
34
-
35
-
36
-
37
-
38
-
39
-
40
-
41
-
42
-
43
-
44
-
45
-
46
-
47
-
48
-
49
-
50
-
51
-
52
-
53
-
54
-
55
-
56
-
57
-
58
-
59
-
60
-
61
-
62
-
63
-
64
-
65
-
66
-
67
-
 68
68 -
 69
69 -
 70
70 -
 71
71 -
 72
72 -
 73
73 -
 74
74 -
 75
75 -
 76
76 -
 77
77 -
 78
78 -
 79
79 -
 80
80 -
 81
81 -
 82
82 -
 83
83 -
 84
84 -
 85
85 -
 86
86 -
 87
87 -
 88
88 -
89
-
90
-
91
-
92
-
93
-
94
-
95
-
96
-
97
-
98
-
99
-
100
-
101
-
102
-
103
-
104
-
105
-
106
-
107
-
108
-
109
-
110
-
111
-
112
-
113
-
114
-
115
-
116
-
117
-
118
-
119
-
120
 |
 |

NOTES TO THE CONSOLIDATED FINANCIAL STATEMENTS (Continued)
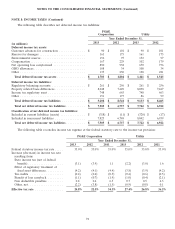
NOTE 8: INCOME TAXES (Continued)
The following table describes net deferred income tax liabilities:
PG&E
Corporation Utility
Year Ended December 31,
2013 2012 2013 2012
(in millions)
Deferred income tax assets:
Customer advances for construction ............... $ 90 $ 101 $ 90 $ 101
Reserve for damages .......................... 161 175 161 175
Environmental reserve ......................... 152 97 152 97
Compensation ............................... 167 229 102 179
Net operating loss carryforward .................. 890 938 670 736
GHG allowances ............................. 108 34 108 34
Other ..................................... 135 230 128 221
Total deferred income tax assets ................ $ 1,703 $ 1,804 $ 1,411 $ 1,543
Deferred income tax liabilities:
Regulatory balancing accounts ................... $ 261 $ 256 $ 261 $ 256
Property related basis differences ................. 8,048 7,449 8,038 7,447
Income tax regulatory asset ..................... 748 663 748 663
Other ..................................... 151 173 86 99
Total deferred income tax liabilities ............. $ 9,208 $ 8,541 $ 9,133 $ 8,465
Total net deferred income tax liabilities ........... $ 7,505 $ 6,737 $ 7,722 $ 6,922
Classification of net deferred income tax liabilities:
Included in current liabilities (assets) .............. $ (318) $ (11) $ (320) $ (17)
Included in noncurrent liabilities ................. 7,823 6,748 8,042 6,939
Total net deferred income tax liabilities ........... $ 7,505 $ 6,737 $ 7,722 $ 6,922
The following table reconciles income tax expense at the federal statutory rate to the income tax provision:
PG&E Corporation Utility
Year Ended December 31,
2013 2012 2011 2013 2012 2011
Federal statutory income tax rate ..... 35.0% 35.0% 35.0% 35.0% 35.0% 35.0%
Increase (decrease) in income tax rate
resulting from:
State income tax (net of federal
benefit) .................... (3.1) (3.9) 1.1 (2.2) (3.0) 1.6
Effect of regulatory treatment of
fixed asset differences .......... (4.2) (4.1) (4.4) (3.8) (3.9) (4.2)
Tax credits ................... (0.4) (0.6) (0.5) (0.4) (0.6) (0.5)
Benefit of loss carryback ......... (1.1) (0.7) (1.9) (1.0) (0.4) (2.1)
Non deductible penalties ......... 0.8 0.6 6.5 0.7 0.5 6.3
Other, net .................... (2.2) (3.8) (1.5) (0.9) (0.8) 0.1
Effective tax rate ................ 24.8% 22.5% 34.3% 27.4% 26.8% 36.2%
72