PG&E 2013 Annual Report Download - page 14
Download and view the complete annual report
Please find page 14 of the 2013 PG&E annual report below. You can navigate through the pages in the report by either clicking on the pages listed below, or by using the keyword search tool below to find specific information within the annual report.-
 1
1 -
2
-
3
-
 4
4 -
 5
5 -
 6
6 -
 7
7 -
 8
8 -
 9
9 -
 10
10 -
 11
11 -
 12
12 -
 13
13 -
 14
14 -
 15
15 -
 16
16 -
 17
17 -
 18
18 -
 19
19 -
 20
20 -
 21
21 -
 22
22 -
 23
23 -
 24
24 -
25
-
26
-
27
-
28
-
29
-
30
-
31
-
32
-
33
-
34
-
35
-
36
-
37
-
38
-
39
-
40
-
41
-
42
-
43
-
44
-
45
-
46
-
47
-
48
-
49
-
50
-
51
-
52
-
53
-
54
-
55
-
56
-
57
-
58
-
59
-
60
-
61
-
62
-
63
-
64
-
65
-
66
-
67
-
68
-
69
-
70
-
71
-
72
-
73
-
74
-
75
-
76
-
77
-
78
-
79
-
80
-
81
-
82
-
83
-
84
-
85
-
86
-
87
-
88
-
89
-
90
-
91
-
92
-
93
-
94
-
95
-
96
-
97
-
98
-
99
-
100
-
101
-
102
-
103
-
104
-
105
-
106
-
107
-
108
-
109
-
110
-
111
-
112
-
113
-
114
-
115
-
116
-
117
-
118
-
119
-
120
 |
 |

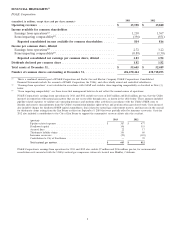
Utility Activities Impacting Earnings
The following discussion presents the Utility’s operating results for activities impacting earnings for 2013, 2012,
and 2011.
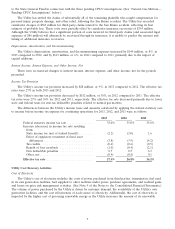
Operating Revenues
The Utility’s electric and natural gas operating revenues increased by $55 million, or 1%, in 2013 compared to
2012, primarily due to an increase of $294 million as authorized in various rate cases, partially offset by a decrease in
revenues of $196 million as a result of the lower return authorized in the 2013 Cost of Capital proceeding.
The Utility’s electric and natural gas operating revenues increased by $340 million, or 4%, in 2012 compared to
2011 primarily due to an increase in revenues authorized in various rate cases and increases in natural gas storage
revenues.
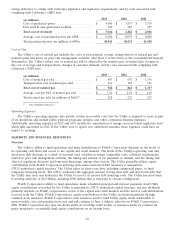
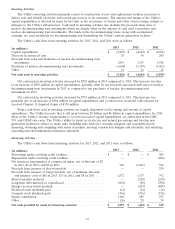
Operating and Maintenance
The Utility’s operating and maintenance expenses decreased by $189 million, or 4%, in 2013 compared to 2012,
primarily due to decreases of $167 million for net costs incurred in connection with natural gas matters (see table
below) and $88 million for environmental remediation costs associated with a significant charge in 2012 for the
Hinkley natural gas compressor station site. These costs were partially offset by increases in other expenses that were
not material. In each of 2013 and 2012, the Utility incurred expenses that were approximately $250 million higher
than the level of authorized revenue requirements to improve the safety and reliability of its operations that will not
be recovered in rates.
The Utility’s operating and maintenance expenses increased by $476 million, or 12%, in 2012 compared to 2011,
primarily due to costs incurred to improve the safety and reliability of electric and natural gas operations that were
approximately $250 million higher than amounts assumed under the 2011 rate cases. The remaining increase was
primarily attributable to an increase of $73 million for net costs incurred in connection with natural gas matters (see
table below), and a $56 million charge related to employee operational performance incentives.
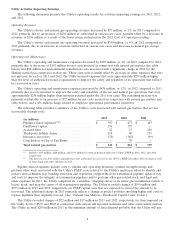
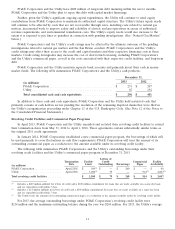
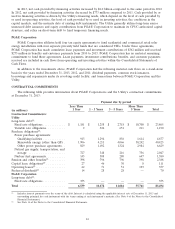
The following table provides a summary of the Utility’s costs associated with natural gas matters that are not
recoverable through rates:
2013 2012 2011
(in millions)
Pipeline-related expenses(1)(2) .................. $ 387 $ 477 $ 483
Disallowed capital .......................... 196 353 —
Accrued fines ............................. 22 17 200
Third-party liability claims .................... 110 80 155
Insurance recoveries ........................ (70) (185) (99)
Contribution to City of San Bruno .............. — 70 —
Total natural gas matters .................... $ 645 $ 812 $ 739
(1) Includes $137 million, $268 million, and $331 million for work performed under the Utility’s PSEP in 2013, 2012, and 2011,
respectively.
(2) The decrease for 2013 reflects amounts that were authorized for recovery in the CPUC’s PSEP December 2012 decision as well
as lower legal and other expenses in 2013.
Pipeline-related expenses include costs to validate safe operating pressures, conduct strength testing, and
perform other work associated with the Utility’s PSEP; costs related to the Utility’s multi-year effort to identify and
remove encroachments (e.g. building structures and vegetation overgrowth) from transmission pipeline rights-of-way,
and costs to improve the integrity of transmission pipelines and to perform other gas-related work; and legal and
other expenses. In 2013, the Utility completed its ‘‘centerline’’ mapping survey of its entire gas transmission system to
locate, mark, and map the center of all transmission pipelines. The Utility recorded charges of $196 million and
$353 million in 2013 and 2012, respectively, for PSEP capital costs that are expected to exceed the amount to be
recovered. The additional charge in 2013 primarily reflects a change in project portfolio involving higher unit costs to
replace pipelines than originally forecast. (See ‘‘Natural Gas Matters—Disallowed Capital Costs’’ below.)
The Utility recorded charges of $22 million and $17 million in 2013 and 2012, respectively, for fines imposed on
the Utility by the CPUC and SED in connection with various self-reported violations and other enforcement matters.
The Utility accrued $200 million in 2011 as the minimum amount of fines deemed probable that the Utility will pay
8