PG&E 2013 Annual Report Download - page 94
Download and view the complete annual report
Please find page 94 of the 2013 PG&E annual report below. You can navigate through the pages in the report by either clicking on the pages listed below, or by using the keyword search tool below to find specific information within the annual report.-
 1
1 -
2
-
3
-
4
-
5
-
6
-
7
-
8
-
9
-
10
-
11
-
12
-
13
-
14
-
15
-
16
-
17
-
18
-
19
-
20
-
21
-
22
-
23
-
24
-
25
-
26
-
27
-
28
-
29
-
30
-
31
-
32
-
33
-
34
-
35
-
36
-
37
-
38
-
39
-
40
-
41
-
42
-
43
-
44
-
45
-
46
-
47
-
48
-
49
-
50
-
51
-
52
-
53
-
54
-
55
-
56
-
57
-
58
-
59
-
60
-
61
-
62
-
63
-
64
-
65
-
66
-
67
-
68
-
69
-
70
-
71
-
72
-
73
-
74
-
75
-
76
-
77
-
78
-
79
-
80
-
81
-
82
-
83
-
 84
84 -
 85
85 -
 86
86 -
 87
87 -
 88
88 -
 89
89 -
 90
90 -
 91
91 -
 92
92 -
 93
93 -
 94
94 -
 95
95 -
 96
96 -
 97
97 -
 98
98 -
 99
99 -
 100
100 -
 101
101 -
 102
102 -
 103
103 -
 104
104 -
105
-
106
-
107
-
108
-
109
-
110
-
111
-
112
-
113
-
114
-
115
-
116
-
117
-
118
-
119
-
120
 |
 |

NOTES TO THE CONSOLIDATED FINANCIAL STATEMENTS (Continued)
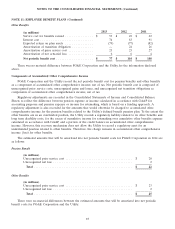
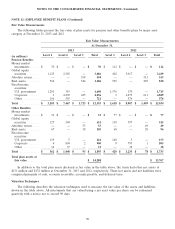
NOTE 11: EMPLOYEE BENEFIT PLANS (Continued)
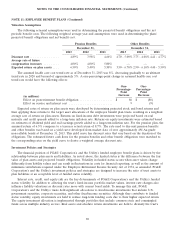
Valuation Assumptions
The following actuarial assumptions were used in determining the projected benefit obligations and the net
periodic benefit costs. The following weighted average year-end assumptions were used in determining the plans’
projected benefit obligations and net benefit cost.
Pension Benefits Other Benefits
December 31, December 31,
2013 2012 2011 2013 2012 2011
Discount rate ................. 4.89% 3.98% 4.66% 4.70 - 5.00% 3.75 - 4.08% 4.41 - 4.77%
Average rate of future
compensation increases ......... 4.00% 4.00% 5.00% — — —
Expected return on plan assets .... 6.50% 5.40% 5.50% 3.50 - 6.70% 2.90 - 6.10% 4.40 - 5.50%
The assumed health care cost trend rate as of December 31, 2013 was 8%, decreasing gradually to an ultimate
trend rate in 2020 and beyond of approximately 5%. A one-percentage-point change in assumed health care cost
trend rate would have the following effects:
One- One-
Percentage- Percentage-
Point Point
Increase Decrease
(in millions)
Effect on postretirement benefit obligation ................... $ 86 $ (88)
Effect on service and interest cost ......................... 9 (9)
Expected rates of return on plan assets were developed by determining projected stock and bond returns and
then applying these returns to the target asset allocations of the employee benefit plan trusts, resulting in a weighted
average rate of return on plan assets. Returns on fixed-income debt investments were projected based on real
maturity and credit spreads added to a long-term inflation rate. Returns on equity investments were estimated based
on estimates of dividend yield and real earnings growth added to a long-term inflation rate. For the pension plan, the
assumed return of 6.5% compares to a ten-year actual return of 8.7%. The rate used to discount pension benefits
and other benefits was based on a yield curve developed from market data of over approximately 494 Aa-grade
non-callable bonds at December 31, 2013. This yield curve has discount rates that vary based on the duration of the
obligations. The estimated future cash flows for the pension benefits and other benefit obligations were matched to
the corresponding rates on the yield curve to derive a weighted average discount rate.
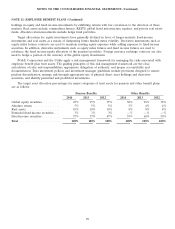
Investment Policies and Strategies
The financial position of PG&E Corporation’s and the Utility’s funded employee benefit plans is driven by the
relationship between plan assets and liabilities. As noted above, the funded status is the difference between the fair
value of plan assets and projected benefit obligations. Volatility in funded status occurs when asset values change
differently from liability values and can result in fluctuations in costs for financial reporting, as well as the amount of
minimum contributions required under the Employee Retirement Income Security Act of 1974, as amended. PG&E
Corporation’s and the Utility’s investment policies and strategies are designed to increase the ratio of trust assets to
plan liabilities at an acceptable level of funded status volatility.
Interest rate, credit, and equity risk are the key determinants of PG&E Corporation’s and the Utility’s funded
status volatility. In addition to affecting the trust’s fixed-income portfolio market values, interest rate changes also
influence liability valuations as discount rates move with current bond yields. To manage this risk, PG&E
Corporation’s and the Utility’s trusts hold significant allocations to fixed-income investments that include U.S.
government securities, corporate securities, and other fixed-income securities. Although they contribute to funded
status volatility, equity investments are held to reduce long-term funding costs due to their higher expected return.
The equity investment allocation is implemented through portfolios that include common stock and commingled
funds across multiple industry sectors. Real assets and absolute return investments are held to diversify the trust’s
88