PG&E 2013 Annual Report Download - page 13
Download and view the complete annual report
Please find page 13 of the 2013 PG&E annual report below. You can navigate through the pages in the report by either clicking on the pages listed below, or by using the keyword search tool below to find specific information within the annual report.-
 1
1 -
2
-
 3
3 -
 4
4 -
 5
5 -
 6
6 -
 7
7 -
 8
8 -
 9
9 -
 10
10 -
 11
11 -
 12
12 -
 13
13 -
 14
14 -
 15
15 -
 16
16 -
 17
17 -
 18
18 -
 19
19 -
 20
20 -
 21
21 -
 22
22 -
 23
23 -
24
-
25
-
26
-
27
-
28
-
29
-
30
-
31
-
32
-
33
-
34
-
35
-
36
-
37
-
38
-
39
-
40
-
41
-
42
-
43
-
44
-
45
-
46
-
47
-
48
-
49
-
50
-
51
-
52
-
53
-
54
-
55
-
56
-
57
-
58
-
59
-
60
-
61
-
62
-
63
-
64
-
65
-
66
-
67
-
68
-
69
-
70
-
71
-
72
-
73
-
74
-
75
-
76
-
77
-
78
-
79
-
80
-
81
-
82
-
83
-
84
-
85
-
86
-
87
-
88
-
89
-
90
-
91
-
92
-
93
-
94
-
95
-
96
-
97
-
98
-
99
-
100
-
101
-
102
-
103
-
104
-
105
-
106
-
107
-
108
-
109
-
110
-
111
-
112
-
113
-
114
-
115
-
116
-
117
-
118
-
119
-
120
 |
 |

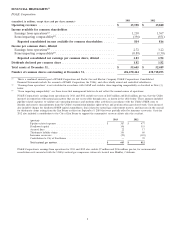
RESULTS OF OPERATIONS
PG&E Corporation
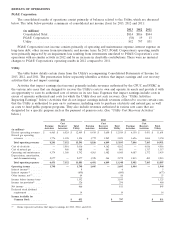
The consolidated results of operations consist primarily of balances related to the Utility, which are discussed
below. The table below provides a summary of consolidated net income (loss) for 2013, 2012 and 2011:
2013 2012 2011
(in millions)
Consolidated Total ........................................... $814 $816 $844
PG&E Corporation .......................................... (38) 19 13
Utility .................................................... 852 797 831
PG&E Corporation’s net income consists primarily of operating and maintenance expense, interest expense on
long-term debt, other income from investments, and income taxes. In 2013, PG&E Corporation’s operating results
were primarily impacted by an impairment loss resulting from investments unrelated to PG&E Corporation’s core
operations with no similar activity in 2012 and by an increase in charitable contributions. There were no material
changes to PG&E Corporation’s operating results in 2012 compared to 2011.
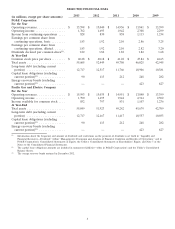
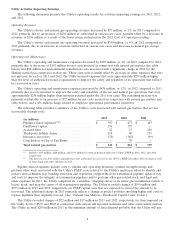
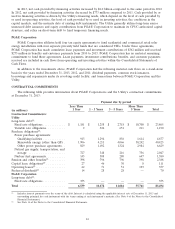
Utility
The table below details certain items from the Utility’s accompanying Consolidated Statements of Income for
2013, 2012, and 2011. The presentation below separately identifies activities that impact earnings and cost recovery
activities that do not impact earnings.
Activities that impact earnings (net income) primarily include revenues authorized by the CPUC and FERC in
the various rate cases that are designed to recover the Utility’s costs to own and operate its assets and provide it with
an opportunity to earn its authorized rate of return on its rate base. Expenses that impact earnings include costs in
excess of amounts authorized and costs for which the Utility does not seek recovery. (See ‘‘Utility Activities
Impacting Earnings’’ below.) Activities that do not impact earnings include revenues collected to recover certain costs
that the Utility is authorized to pass on to customers, including costs to purchase electricity and natural gas, as well
as costs to fund public purpose programs. They also include revenues authorized in various rate cases that are
designated for a specific purpose such as the payment of pension costs. (See ‘‘Utility Cost Recovery Activities’’
below.)
2013 2012 2011
Cost Cost Cost
Earning Recovery Total Earning Recovery Total Earning Recovery Total
Activities Activities Utility Activities Activities Utility Activities Activities Utility
(in millions)
Electric operating revenues . $ 6,465 $ 6,024 $ 12,489 $ 6,414 $ 5,600 $ 12,014 $ 6,150 $ 5,451 $ 11,601
Natural gas operating
revenues ........... 1,776 1,328 3,104 1,772 1,249 3,021 1,696 1,654 3,350
Total operating revenues .8,241 7,352 15,593 8,186 6,849 15,035 7,846 7,105 14,951
Cost of electricity ....... — 5,016 5,016 — 4,162 4,162 — 4,016 4,016
Cost of natural gas ...... — 968 968 — 861 861 — 1,317 1,317
Operating and maintenance . 4,374 1,368 5,742 4,563 1,482 6,045 4,087 1,372 5,459
Depreciation, amortization,
and decommissioning . . . 2,077 — 2,077 1,928 344 2,272 1,815 400 2,215
Total operating expenses .6,451 7,352 13,803 6,491 6,849 13,340 5,902 7,105 13,007
Operating income ....... 1,790 — 1,790 1,695 — 1,695 1,944 — 1,944
Interest income(1) .......865
Interest expense(1) ....... (690) (680) (677)
Other income, net(1) ...... 84 88 53
Income before income taxes 1,192 1,109 1,325
Income tax provision(1) .... 326 298 480
Net income ........... 866 811 845
Preferred stock dividend
requirement ......... 14 14 14
Income Available for
Common Stock ....... $ 852 $ 797 $ 831
(1) Items represent activities that impact earnings for 2013, 2012, and 2011.
7