PG&E 2013 Annual Report Download - page 75
Download and view the complete annual report
Please find page 75 of the 2013 PG&E annual report below. You can navigate through the pages in the report by either clicking on the pages listed below, or by using the keyword search tool below to find specific information within the annual report.-
 1
1 -
2
-
3
-
4
-
5
-
6
-
7
-
8
-
9
-
10
-
11
-
12
-
13
-
14
-
15
-
16
-
17
-
18
-
19
-
20
-
21
-
22
-
23
-
24
-
25
-
26
-
27
-
28
-
29
-
30
-
31
-
32
-
33
-
34
-
35
-
36
-
37
-
38
-
39
-
40
-
41
-
42
-
43
-
44
-
45
-
46
-
47
-
48
-
49
-
50
-
51
-
52
-
53
-
54
-
55
-
56
-
57
-
58
-
59
-
60
-
61
-
62
-
63
-
64
-
 65
65 -
 66
66 -
 67
67 -
 68
68 -
 69
69 -
 70
70 -
 71
71 -
 72
72 -
 73
73 -
 74
74 -
 75
75 -
 76
76 -
 77
77 -
 78
78 -
 79
79 -
 80
80 -
 81
81 -
 82
82 -
 83
83 -
 84
84 -
 85
85 -
86
-
87
-
88
-
89
-
90
-
91
-
92
-
93
-
94
-
95
-
96
-
97
-
98
-
99
-
100
-
101
-
102
-
103
-
104
-
105
-
106
-
107
-
108
-
109
-
110
-
111
-
112
-
113
-
114
-
115
-
116
-
117
-
118
-
119
-
120
 |
 |

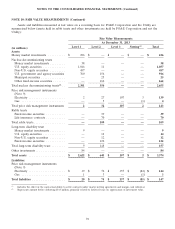
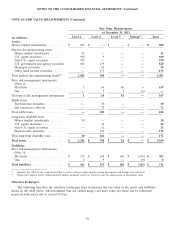
NOTES TO THE CONSOLIDATED FINANCIAL STATEMENTS (Continued)
NOTE 5: COMMON STOCK AND SHARE-BASED COMPENSATION (Continued)
Share-based compensation costs capitalized during 2013, 2012, and 2011 was immaterial. There was no material
difference between PG&E Corporation and the Utility for the information disclosed above.
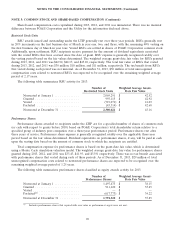
Restricted Stock Units
RSU awards issued and outstanding under the LTIP generally vest over three year periods. RSUs generally vest
in 20% increments on the first business day of March in year one, two, and three, with the remaining 40% vesting on
the first business day of March in year four. Vested RSUs are settled in shares of PG&E Corporation common stock.
Additionally, upon settlement, RSU recipients receive payment for the amount of dividend equivalents associated
with the vested RSUs that have accrued since the date of grant. RSU expense is generally recognized ratably over
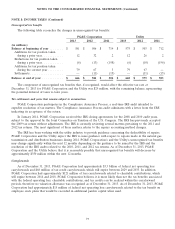
the vesting period based on the fair values determined. The weighted average grant-date fair value for RSUs granted
during 2013, 2012, and 2011 was $42.92, $42.17, and $45.10, respectively. The total fair value of RSUs that vested
during 2013, 2012, and 2011 was $30 million, $18 million, and $11 million, respectively. The tax benefit from RSUs
that vested during each period was not material. As of December 31, 2013, $50 million of total unrecognized
compensation costs related to nonvested RSUs was expected to be recognized over the remaining weighted average
period of 2.17 years.
The following table summarizes RSU activity for 2013:
Number of Weighted Average Grant-
Restricted Stock Units Date Fair Value
Nonvested at January 1 .............. 2,069,291 $ 42.52
Granted ......................... 993,115 $ 42.92
Vested .......................... (719,071) $ 41.03
Forfeited ........................ (43,314) $ 42.68
Nonvested at December 31 ........... 2,300,021 $ 43.16
Performance Shares
Performance shares awarded to recipients under the LTIP are for a specified number of shares of common stock
(or cash with respect to grants before 2010) based on PG&E Corporation’s total shareholder return relative to a
specified group of industry peer companies over a three-year performance period. Performance shares vest after
three years of service. Performance share expense is generally recognized ratably over the applicable three-year
period based on the fair values determined. Dividend equivalents on performance shares, if any, will be paid in cash
upon the vesting date based on the amount of common stock to which the recipients are entitled.
Total compensation expense for performance shares is based on the grant-date fair value, which is determined
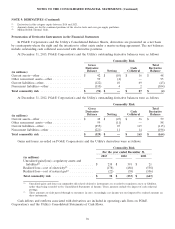
using a Monte Carlo simulation valuation model. The weighted average grant-date fair value for performance shares
granted during 2013, 2012, and 2011 was $33.45, $41.93, and $33.91 respectively. There was no tax benefit associated
with performance shares that vested during each of these periods. As of December 31, 2013, $29 million of total
unrecognized compensation costs related to nonvested performance shares are expected to be recognized over the
remaining weighted average period of 1.25 years.
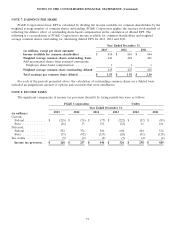
The following table summarizes performance shares classified as equity awards activity for 2013:
Number of Weighted Average Grant-
Performance Shares Date Fair Value
Nonvested at January 1 .............. 1,497,473 $ 38.15
Granted ......................... 911,620 $ 33.45
Vested .......................... — $ —
Forfeited(1) ....................... (617,773) $ 34.22
Nonvested at December 31 ........... 1,791,320 $ 37.85
(1) Includes performance shares that expired with zero value as performance targets were not met.
69