PG&E 2013 Annual Report Download - page 89
Download and view the complete annual report
Please find page 89 of the 2013 PG&E annual report below. You can navigate through the pages in the report by either clicking on the pages listed below, or by using the keyword search tool below to find specific information within the annual report.-
 1
1 -
2
-
3
-
4
-
5
-
6
-
7
-
8
-
9
-
10
-
11
-
12
-
13
-
14
-
15
-
16
-
17
-
18
-
19
-
20
-
21
-
22
-
23
-
24
-
25
-
26
-
27
-
28
-
29
-
30
-
31
-
32
-
33
-
34
-
35
-
36
-
37
-
38
-
39
-
40
-
41
-
42
-
43
-
44
-
45
-
46
-
47
-
48
-
49
-
50
-
51
-
52
-
53
-
54
-
55
-
56
-
57
-
58
-
59
-
60
-
61
-
62
-
63
-
64
-
65
-
66
-
67
-
68
-
69
-
70
-
71
-
72
-
73
-
74
-
75
-
76
-
77
-
78
-
 79
79 -
 80
80 -
 81
81 -
 82
82 -
 83
83 -
 84
84 -
 85
85 -
 86
86 -
 87
87 -
 88
88 -
 89
89 -
 90
90 -
 91
91 -
 92
92 -
 93
93 -
 94
94 -
 95
95 -
 96
96 -
 97
97 -
 98
98 -
 99
99 -
100
-
101
-
102
-
103
-
104
-
105
-
106
-
107
-
108
-
109
-
110
-
111
-
112
-
113
-
114
-
115
-
116
-
117
-
118
-
119
-
120
 |
 |

NOTES TO THE CONSOLIDATED FINANCIAL STATEMENTS (Continued)
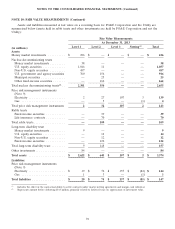
NOTE 10: FAIR VALUE MEASUREMENTS (Continued)
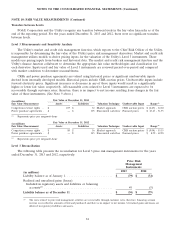
Available for Sale Investments
The following table provides a summary of available-for-sale investments:
Total Total
Amortized Unrealized Unrealized Total Fair
Cost Gains Losses Value
(in millions)
As of December 31, 2013
Nuclear decommissioning trusts
Money market investments ....... $ 38 $ — $ — $ 38
Equity securities
U.S. ....................... 246 811 — 1,057
Non-U.S. ................... 215 242 — 457
Debt securities
U.S. government and agency
securities .............. 870 51 (5) 916
Municipal securities ........ 24 2 (1) 25
Other fixed-income securities . 163 1 (2) 162
Total nuclear decommissioning
trusts(1) ..................... 1,556 1,107 (8) 2,655
Other investments ............... 13 71 — 84
Total ........................ $ 1,569 $ 1,178 $ (8) $ 2,739
As of December 31, 2012
Nuclear decommissioning trusts
Money market investments ........ $ 21 $ — $ — $ 21
Equity securities
U.S. ....................... 331 618 — 949
Non-U.S. ................... 199 181 (1) 379
Debt securities
U.S. government and agency
securities ................ 723 97 — 820
Municipal securities .......... 56 4 (1) 59
Other fixed-income securities . . . 168 5 — 173
Total(1) ....................... $ 1,498 $ 905 $ (2) $ 2,401
(1) Represents amounts before deducting $313 million and $240 million at December 31, 2013 and 2012, respectively, primarily
related to deferred taxes on appreciation of investment value.
The fair value of debt securities by contractual maturity is as follows:
As of
December 31, 2013
(in millions)
Less than 1 year ............................................ $ 22
1 - 5 years ................................................. 519
5 - 10 years ................................................ 230
More than 10 years .......................................... 332
Total maturities of debt securities ................................ $ 1,103
83