PG&E 2013 Annual Report Download - page 96
Download and view the complete annual report
Please find page 96 of the 2013 PG&E annual report below. You can navigate through the pages in the report by either clicking on the pages listed below, or by using the keyword search tool below to find specific information within the annual report.-
 1
1 -
2
-
3
-
4
-
5
-
6
-
7
-
8
-
9
-
10
-
11
-
12
-
13
-
14
-
15
-
16
-
17
-
18
-
19
-
20
-
21
-
22
-
23
-
24
-
25
-
26
-
27
-
28
-
29
-
30
-
31
-
32
-
33
-
34
-
35
-
36
-
37
-
38
-
39
-
40
-
41
-
42
-
43
-
44
-
45
-
46
-
47
-
48
-
49
-
50
-
51
-
52
-
53
-
54
-
55
-
56
-
57
-
58
-
59
-
60
-
61
-
62
-
63
-
64
-
65
-
66
-
67
-
68
-
69
-
70
-
71
-
72
-
73
-
74
-
75
-
76
-
77
-
78
-
79
-
80
-
81
-
82
-
83
-
84
-
85
-
 86
86 -
 87
87 -
 88
88 -
 89
89 -
 90
90 -
 91
91 -
 92
92 -
 93
93 -
 94
94 -
 95
95 -
 96
96 -
 97
97 -
 98
98 -
 99
99 -
 100
100 -
 101
101 -
 102
102 -
 103
103 -
 104
104 -
 105
105 -
 106
106 -
107
-
108
-
109
-
110
-
111
-
112
-
113
-
114
-
115
-
116
-
117
-
118
-
119
-
120
 |
 |

NOTES TO THE CONSOLIDATED FINANCIAL STATEMENTS (Continued)
NOTE 11: EMPLOYEE BENEFIT PLANS (Continued)
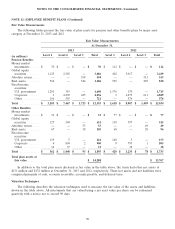
Fair Value Measurements
The following tables present the fair value of plan assets for pension and other benefits plans by major asset
category at December 31, 2013 and 2012.
Fair Value Measurements
At December 31,
2013 2012
Level 1 Level 2 Level 3 Total Level 1 Level 2 Level 3 Total
(in millions)
Pension Benefits:
Money market
investments ..... $ 70 $ — $ — $70$112$—$—$ 112
Global equity
securities ....... 1,123 2,363 — 3,486 402 3,017 — 3,419
Absolute return .... — — 554 554 — — 513 513
Real assets ....... 562 — 544 1,106 525 — 285 810
Fixed-income
securities:
U.S. government . 1,281 319 — 1,600 1,576 139 — 1,715
Corporate ...... 1 4,230 625 4,856 3 4,275 611 4,889
Other ......... 166 555 — 721 — 576 — 576
Total ........... $ 3,203 $ 7,467 $ 1,723 $ 12,393 $ 2,618 $ 8,007 $ 1,409 $ 12,034
Other Benefits:
Money market
investments ..... $ 31 $ — $ — $31$ 77$ —$ —$77
Global equity
securities ....... 127 504 — 631 118 397 — 515
Absolute return ....——5353 ——4949
Real assets ....... 67 — 38 105 68—2896
Fixed-income
securities:
U.S. government . 119 5 — 124 148 5 — 153
Corporate ...... 4 894 2 900 9 795 1 805
Other ......... 14 37 — 51 —38—38
Total ........... $ 362 $ 1,440 $ 93 $ 1,895 $ 420 $ 1,235 $ 78 $ 1,733
Total plan assets at
fair value ....... $ 14,288 $ 13,767
In addition to the total plan assets disclosed at fair value in the table above, the trusts had other net assets of
$131 million and $132 million at December 31, 2013 and 2012, respectively. These net assets and net liabilities were
comprised primarily of cash, accounts receivable, accounts payable, and deferred taxes.
Valuation Techniques
The following describes the valuation techniques used to measure the fair value of the assets and liabilities
shown in the table above. All investments that are valued using a net asset value per share can be redeemed
quarterly with a notice not to exceed 90 days.
90