PG&E 2013 Annual Report Download - page 15
Download and view the complete annual report
Please find page 15 of the 2013 PG&E annual report below. You can navigate through the pages in the report by either clicking on the pages listed below, or by using the keyword search tool below to find specific information within the annual report.-
 1
1 -
2
-
3
-
4
-
 5
5 -
 6
6 -
 7
7 -
 8
8 -
 9
9 -
 10
10 -
 11
11 -
 12
12 -
 13
13 -
 14
14 -
 15
15 -
 16
16 -
 17
17 -
 18
18 -
 19
19 -
 20
20 -
 21
21 -
 22
22 -
 23
23 -
 24
24 -
 25
25 -
26
-
27
-
28
-
29
-
30
-
31
-
32
-
33
-
34
-
35
-
36
-
37
-
38
-
39
-
40
-
41
-
42
-
43
-
44
-
45
-
46
-
47
-
48
-
49
-
50
-
51
-
52
-
53
-
54
-
55
-
56
-
57
-
58
-
59
-
60
-
61
-
62
-
63
-
64
-
65
-
66
-
67
-
68
-
69
-
70
-
71
-
72
-
73
-
74
-
75
-
76
-
77
-
78
-
79
-
80
-
81
-
82
-
83
-
84
-
85
-
86
-
87
-
88
-
89
-
90
-
91
-
92
-
93
-
94
-
95
-
96
-
97
-
98
-
99
-
100
-
101
-
102
-
103
-
104
-
105
-
106
-
107
-
108
-
109
-
110
-
111
-
112
-
113
-
114
-
115
-
116
-
117
-
118
-
119
-
120
 |
 |

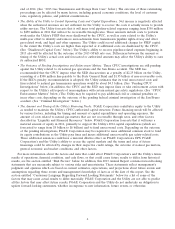
to the State General Fund in connection with the three pending CPUC investigations. (See ‘‘Natural Gas Matters—
Pending CPUC Investigations’’ below.)
The Utility has settled the claims of substantially all of the remaining plaintiffs who sought compensation for
personal injury, property damage, and other relief, following the San Bruno accident. The Utility has recorded
cumulative charges of $565 million for third-party claims related to the San Bruno accident, reflecting its best
estimate of probable loss. These costs were partially offset by cumulative insurance recoveries of $354 million.
Although the Utility believes that a significant portion of costs incurred for third-party claims (and associated legal
expenses of $86 million) will ultimately be recovered through its insurance, it is unable to predict the amount and
timing of additional insurance recoveries.
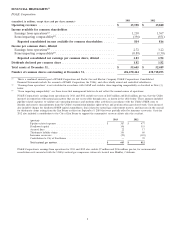
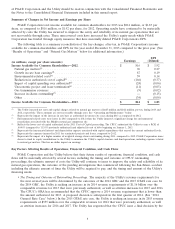
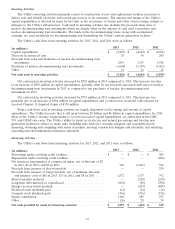
Depreciation, Amortization, and Decommissioning
The Utility’s depreciation, amortization, and decommissioning expenses increased by $149 million, or 8%, in
2013 compared to 2012, and by $113 million, or 6%, in 2012 compared to 2011, primarily due to the impact of
capital additions.
Interest Income, Interest Expense, and Other Income, Net
There were no material changes to interest income, interest expense, and other income, net for the periods
presented.
Income Tax Provision
The Utility’s income tax provision increased by $28 million, or 9%, in 2013 compared to 2012. The effective tax
rates were 27% in both 2013 and 2012.
The Utility’s income tax provision decreased by $182 million, or 38%, in 2012 compared to 2011. The effective
tax rates were 27% and 36% for 2012 and 2011, respectively. The effective tax rate decreased primarily due to lower
state and federal taxes for non-tax deductible penalties related to natural gas matters.
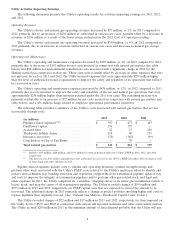
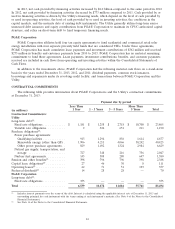
The differences between the Utility’s income taxes and amounts calculated by applying the federal statutory rate
to income before income tax expense for continuing operations for 2013, 2012, and 2011 were as follows:
2013 2012 2011
Federal statutory income tax rate ............... 35.0% 35.0% 35.0%
Increase (decrease) in income tax rate resulting
from:
State income tax (net of federal benefit) ........ (2.2) (3.0) 1.6
Effect of regulatory treatment of fixed asset
differences ............................ (3.8) (3.9) (4.2)
Tax credits .............................. (0.4) (0.6) (0.5)
Benefit of loss carryback ................... (1.0) (0.4) (2.1)
Non deductible penalties ................... 0.7 0.5 6.3
Other, net .............................. (0.9) (0.8) 0.1
Effective tax rate ........................... 27.4% 26.8% 36.2%
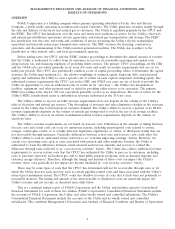
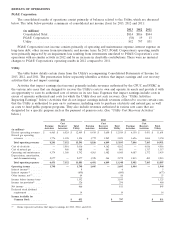
Utility Cost Recovery Activities
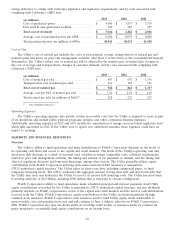
Cost of Electricity
The Utility’s cost of electricity includes the costs of power purchased from third parties, transmission, fuel used
in its own generation facilities, fuel supplied to other facilities under power purchase agreements, and realized gains
and losses on price risk management activities. (See Note 9 of the Notes to the Consolidated Financial Statements.)
The volume of power purchased by the Utility is driven by customer demand, the availability of the Utility’s own
generation facilities, and the cost effectiveness of each source of electricity. Additionally, the cost of electricity is
impacted by the higher cost of procuring renewable energy as the Utility increases the amount of its renewable
9