PG&E 2013 Annual Report Download - page 82
Download and view the complete annual report
Please find page 82 of the 2013 PG&E annual report below. You can navigate through the pages in the report by either clicking on the pages listed below, or by using the keyword search tool below to find specific information within the annual report.-
 1
1 -
2
-
3
-
4
-
5
-
6
-
7
-
8
-
9
-
10
-
11
-
12
-
13
-
14
-
15
-
16
-
17
-
18
-
19
-
20
-
21
-
22
-
23
-
24
-
25
-
26
-
27
-
28
-
29
-
30
-
31
-
32
-
33
-
34
-
35
-
36
-
37
-
38
-
39
-
40
-
41
-
42
-
43
-
44
-
45
-
46
-
47
-
48
-
49
-
50
-
51
-
52
-
53
-
54
-
55
-
56
-
57
-
58
-
59
-
60
-
61
-
62
-
63
-
64
-
65
-
66
-
67
-
68
-
69
-
70
-
71
-
 72
72 -
 73
73 -
 74
74 -
 75
75 -
 76
76 -
 77
77 -
 78
78 -
 79
79 -
 80
80 -
 81
81 -
 82
82 -
 83
83 -
 84
84 -
 85
85 -
 86
86 -
 87
87 -
 88
88 -
 89
89 -
 90
90 -
 91
91 -
 92
92 -
93
-
94
-
95
-
96
-
97
-
98
-
99
-
100
-
101
-
102
-
103
-
104
-
105
-
106
-
107
-
108
-
109
-
110
-
111
-
112
-
113
-
114
-
115
-
116
-
117
-
118
-
119
-
120
 |
 |

NOTES TO THE CONSOLIDATED FINANCIAL STATEMENTS (Continued)
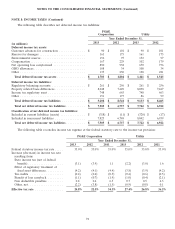
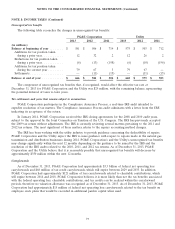
NOTE 9: DERIVATIVES (Continued)
(2) Derivatives in this category expire between 2018 and 2023.
(3) Amounts shown are for the combined positions of the electric fuels and core gas supply portfolios.
(4) Million British Thermal Units.
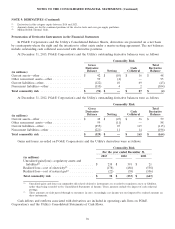
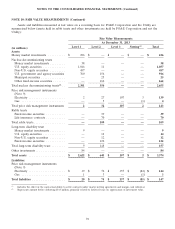
Presentation of Derivative Instruments in the Financial Statements
In PG&E Corporation’s and the Utility’s Consolidated Balance Sheets, derivatives are presented on a net basis
by counterparty where the right and the intention to offset exists under a master netting agreement. The net balances
include outstanding cash collateral associated with derivative positions.
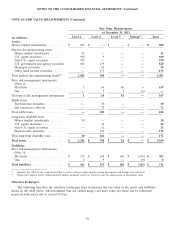
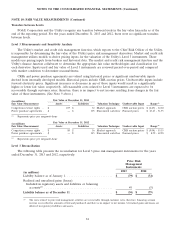
At December 31, 2013, PG&E Corporation’s and the Utility’s outstanding derivative balances were as follows:
Commodity Risk
Gross Total
Derivative Cash Derivative
Balance Netting Collateral Balance
(in millions)
Current assets—other ....................... $ 42 $ (10) $ 16 $ 48
Other noncurrent assets—other ................ 99 (4) — 95
Current liabilities—other ..................... (122) 10 69 (43)
Noncurrent liabilities—other .................. (110) 4 2 (104)
Total commodity risk ....................... $ (91) $ — $ 87 $ (4)
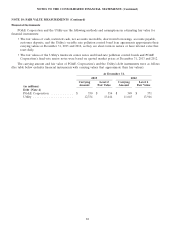
At December 31, 2012, PG&E Corporation’s and the Utility’s outstanding derivative balances were as follows:
Commodity Risk
Gross Total
Derivative Cash Derivative
Balance Netting Collateral Balance
(in millions)
Current assets—other ....................... $ 48 $ (25) $ 36 $ 59
Other noncurrent assets—other ................ 99 (11) — 88
Current liabilities—other ..................... (255) 25 115 (115)
Noncurrent liabilities—other .................. (221) 11 14 (196)
Total commodity risk ....................... $ (329) $ — $ 165 $ (164)
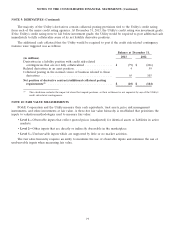
Gains and losses recorded on PG&E Corporation’s and the Utility’s derivatives were as follows:
Commodity Risk
For the year ended December 31,
2013 2012 2011
(in millions)
Unrealized gain/(loss)—regulatory assets and
liabilities(1) ............................. $ 238 $ 391 $ 21
Realized loss—cost of electricity(2) .............. (178) (486) (558)
Realized loss—cost of natural gas(2) ............. (22) (38) (106)
Total commodity risk ....................... $ 38 $ (133) $ (643)
(1) Unrealized gains and losses on commodity risk-related derivative instruments are recorded to regulatory assets or liabilities,
rather than being recorded to the Consolidated Statements of Income. These amounts exclude the impact of cash collateral
postings.
(2) These amounts are fully passed through to customers in rates. Accordingly, net income was not impacted by realized amounts on
these instruments.
Cash inflows and outflows associated with derivatives are included in operating cash flows on PG&E
Corporation’s and the Utility’s Consolidated Statements of Cash Flows.
76