PG&E 2013 Annual Report Download - page 21
Download and view the complete annual report
Please find page 21 of the 2013 PG&E annual report below. You can navigate through the pages in the report by either clicking on the pages listed below, or by using the keyword search tool below to find specific information within the annual report.-
 1
1 -
2
-
3
-
4
-
5
-
6
-
7
-
8
-
9
-
10
-
 11
11 -
 12
12 -
 13
13 -
 14
14 -
 15
15 -
 16
16 -
 17
17 -
 18
18 -
 19
19 -
 20
20 -
 21
21 -
 22
22 -
 23
23 -
 24
24 -
 25
25 -
 26
26 -
 27
27 -
 28
28 -
 29
29 -
 30
30 -
 31
31 -
32
-
33
-
34
-
35
-
36
-
37
-
38
-
39
-
40
-
41
-
42
-
43
-
44
-
45
-
46
-
47
-
48
-
49
-
50
-
51
-
52
-
53
-
54
-
55
-
56
-
57
-
58
-
59
-
60
-
61
-
62
-
63
-
64
-
65
-
66
-
67
-
68
-
69
-
70
-
71
-
72
-
73
-
74
-
75
-
76
-
77
-
78
-
79
-
80
-
81
-
82
-
83
-
84
-
85
-
86
-
87
-
88
-
89
-
90
-
91
-
92
-
93
-
94
-
95
-
96
-
97
-
98
-
99
-
100
-
101
-
102
-
103
-
104
-
105
-
106
-
107
-
108
-
109
-
110
-
111
-
112
-
113
-
114
-
115
-
116
-
117
-
118
-
119
-
120
 |
 |

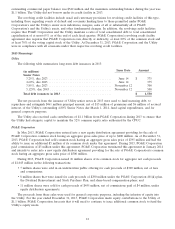
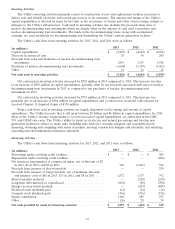
Investing Activities
The Utility’s investing activities primarily consist of construction of new and replacement facilities necessary to
deliver safe and reliable electricity and natural gas services to its customers. The amount and timing of the Utility’s
capital expenditures is affected by many factors such as the occurrence of storms and other events causing outages or
damages to the Utility’s infrastructure. Cash used in investing activities also includes the proceeds from sales of
nuclear decommissioning trust investments which are largely offset by the amount of cash used to purchase new
nuclear decommissioning trust investments. The funds in the decommissioning trusts, along with accumulated
earnings, are used exclusively for decommissioning and dismantling the Utility’s nuclear generation facilities.
The Utility’s cash flows from investing activities for 2013, 2012, and 2011 were as follows:
2013 2012 2011
(in millions)
Capital expenditures ..................................... $ (5,207) $ (4,624) $ (4,038)
Decrease in restricted cash ................................. 29 50 200
Proceeds from sales and maturities of nuclear decommissioning trust
investments .......................................... 1,619 1,133 1,928
Purchases of nuclear decommissioning trust investments ............ (1,604) (1,189) (1,963)
Other ................................................ 21 16 14
Net cash used in investing activities .......................... $ (5,142) $ (4,614) $ (3,859)
Net cash used in investing activities increased by $528 million in 2013 compared to 2012. This increase was due
to an increase of $583 million in capital expenditures, partially offset by net proceeds associated with sales of nuclear
decommissioning trust investments in 2013 as compared to net purchases of nuclear decommissioning trust
investments in 2012.
Net cash used in investing activities increased by $755 million in 2012 compared to 2011. This increase was
primarily due to an increase of $586 million in capital expenditures and a reduction in restricted cash released for
resolved Chapter 11 disputed claims of $150 million.
Future cash flows used in investing activities are largely dependent on the timing and amount of capital
expenditures. The Utility forecasts that it will incur between $5 billion and $6 billion in capital expenditures for 2014.
Most of the Utility’s revenue requirements to recover forecasted capital expenditures are authorized in the GRC,
TO, and GT&S rate cases. The Utility’s ability to invest in its electric and natural gas systems and develop new
generation facilities is subject to many risks, including risks related to securing adequate and reasonably priced
financing, obtaining and complying with terms of permits, meeting construction budgets and schedules, and satisfying
operating and environmental performance standards.
Financing Activities
The Utility’s cash flows from financing activities for 2013, 2012, and 2011 were as follows:
2013 2012 2011
(in millions)
Borrowings under revolving credit facilities ..................... $ — $ — $ 208
Repayments under revolving credit facilities .................... — — (208)
Net issuances (repayments) of commercial paper, net of discount of $2
in 2013, $3 in 2012, and $4 in 2011 ......................... 542 (1,021) 782
Proceeds from issuance of short-term debt ..................... — — 250
Proceeds from issuance of long-term debt, net of premium, discount,
and issuance costs of $18 in 2013, $13 in 2012, and $8 in 2011 ..... 1,532 1,137 792
Short-term debt matured .................................. — (250) (250)
Long-term debt matured or repurchased ....................... (861) (50) (700)
Energy recovery bonds matured ............................. — (423) (404)
Preferred stock dividends paid .............................. (14) (14) (14)
Common stock dividends paid .............................. (716) (716) (716)
Equity contribution ...................................... 1,140 885 555
Other ................................................ (26) 28 54
Net cash provided by (used in) financing activities ............... $ 1,597 $ (424) $ 349
15