PG&E 2013 Annual Report Download - page 87
Download and view the complete annual report
Please find page 87 of the 2013 PG&E annual report below. You can navigate through the pages in the report by either clicking on the pages listed below, or by using the keyword search tool below to find specific information within the annual report.-
 1
1 -
2
-
3
-
4
-
5
-
6
-
7
-
8
-
9
-
10
-
11
-
12
-
13
-
14
-
15
-
16
-
17
-
18
-
19
-
20
-
21
-
22
-
23
-
24
-
25
-
26
-
27
-
28
-
29
-
30
-
31
-
32
-
33
-
34
-
35
-
36
-
37
-
38
-
39
-
40
-
41
-
42
-
43
-
44
-
45
-
46
-
47
-
48
-
49
-
50
-
51
-
52
-
53
-
54
-
55
-
56
-
57
-
58
-
59
-
60
-
61
-
62
-
63
-
64
-
65
-
66
-
67
-
68
-
69
-
70
-
71
-
72
-
73
-
74
-
75
-
76
-
 77
77 -
 78
78 -
 79
79 -
 80
80 -
 81
81 -
 82
82 -
 83
83 -
 84
84 -
 85
85 -
 86
86 -
 87
87 -
 88
88 -
 89
89 -
 90
90 -
 91
91 -
 92
92 -
 93
93 -
 94
94 -
 95
95 -
 96
96 -
 97
97 -
98
-
99
-
100
-
101
-
102
-
103
-
104
-
105
-
106
-
107
-
108
-
109
-
110
-
111
-
112
-
113
-
114
-
115
-
116
-
117
-
118
-
119
-
120
 |
 |

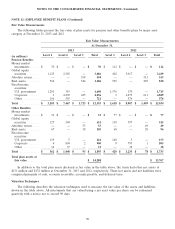
NOTES TO THE CONSOLIDATED FINANCIAL STATEMENTS (Continued)
NOTE 10: FAIR VALUE MEASUREMENTS (Continued)
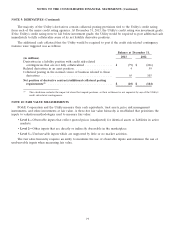
Transfers between Levels
PG&E Corporation and the Utility recognize any transfers between levels in the fair value hierarchy as of the
end of the reporting period. For the years ended December 31, 2013 and 2012, there were no significant transfers
between levels.
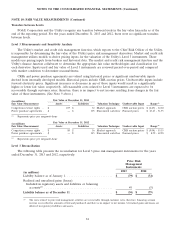
Level 3 Measurements and Sensitivity Analysis
The Utility’s market and credit risk management function, which reports to the Chief Risk Officer of the Utility,
is responsible for determining the fair value of the Utility’s price risk management derivatives. Market and credit risk
management utilizes models to derive pricing inputs for the valuation of the Utility’s Level 3 instruments. These
models use pricing inputs from brokers and historical data. The market and credit risk management function and the
Utility’s finance function collaborate to determine the appropriate fair value methodologies and classification for
each derivative. Inputs used and fair value of Level 3 instruments are reviewed period-over-period and compared
with market conditions to determine reasonableness.
CRRs and power purchase agreements are valued using historical prices or significant unobservable inputs
derived from internally developed models. Historical prices include CRR auction prices. Unobservable inputs include
forward electricity prices. Significant increases or decreases in any of those inputs would result in a significantly
higher or lower fair value, respectively. All reasonable costs related to Level 3 instruments are expected to be
recoverable through customer rates; therefore, there is no impact to net income resulting from changes in the fair
value of these instruments. (See Note 9 above.)
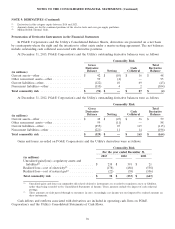
Fair Value at December 31, 2013
(in millions)
Fair Value Measurement Assets Liabilities Valuation Technique Unobservable Input Range(1)
Congestion revenue rights . . $ 107 $ 32 Market approach CRR auction prices $ (6.47) - 12.04
Power purchase agreements . $ — $ 105 Discounted cash flow Forward prices $ 23.43 - 51.75
(1) Represents price per megawatt-hour
Fair Value at December 31, 2012
(in millions)
Fair Value Measurement Assets Liabilities Valuation Technique Unobservable Input Range(1)
Congestion revenue rights . . $ 80 $ 16 Market approach CRR auction prices $ (9.04) - 55.15
Power purchase agreements . $ — $ 145 Discounted cash flow Forward prices $ 8.59 - 62.90
(1) Represents price per megawatt-hour
Level 3 Reconciliation
The following table presents the reconciliation for Level 3 price risk management instruments for the years
ended December 31, 2013 and 2012, respectively:
Price Risk
Management
Instruments
2013 2012
(in millions)
Liability balance as of January 1 ........................... $ (79) $ (74)
Realized and unrealized gains (losses):
Included in regulatory assets and liabilities or balancing
accounts(1) ....................................... 49 (5)
Liability balance as of December 31 ........................ $ (30) $ (79)
(1) The costs related to price risk management activities are recoverable through customer rates, therefore, balancing account
revenue is recorded for amounts settled and purchased and there is no impact to net income. Unrealized gains and losses are
deferred in regulatory liabilities and assets.
81