JCPenney 2015 Annual Report Download - page 89
Download and view the complete annual report
Please find page 89 of the 2015 JCPenney annual report below. You can navigate through the pages in the report by either clicking on the pages listed below, or by using the keyword search tool below to find specific information within the annual report.-
 1
1 -
2
-
3
-
4
-
5
-
6
-
7
-
8
-
9
-
10
-
11
-
12
-
13
-
14
-
15
-
16
-
17
-
18
-
19
-
20
-
21
-
22
-
23
-
24
-
25
-
26
-
27
-
28
-
29
-
30
-
31
-
32
-
33
-
34
-
35
-
36
-
37
-
38
-
39
-
40
-
41
-
42
-
43
-
44
-
45
-
46
-
47
-
48
-
49
-
50
-
51
-
52
-
53
-
54
-
55
-
56
-
57
-
58
-
59
-
60
-
61
-
62
-
63
-
64
-
65
-
66
-
67
-
68
-
69
-
70
-
71
-
72
-
73
-
74
-
75
-
76
-
77
-
78
-
 79
79 -
 80
80 -
 81
81 -
 82
82 -
 83
83 -
 84
84 -
 85
85 -
 86
86 -
 87
87 -
 88
88 -
 89
89 -
 90
90 -
 91
91 -
 92
92 -
 93
93 -
 94
94 -
 95
95 -
 96
96 -
 97
97 -
 98
98 -
 99
99 -
100
-
101
-
102
-
103
-
104
-
105
-
106
-
107
-
108
-
109
-
110
-
111
-
112
-
113
-
114
-
115
-
116
-
117
-
118
-
119
-
120
-
121
-
122
-
123
-
124
-
125
-
126
-
127
-
128
-
129
-
130
-
131
-
132
-
133
-
134
-
135
-
136
-
137
-
138
-
139
-
140
-
141
-
142
-
143
-
144
-
145
-
146
-
147
-
148
-
149
-
150
-
151
-
152
-
153
-
154
-
155
-
156
-
157
-
158
-
159
-
160
-
161
-
162
-
163
-
164
-
165
-
166
-
167
-
168
-
169
-
170
-
171
-
172
-
173
-
174
-
175
-
176
-
177
 |
 |

Table of Contents
Cash
$ 10
$ 2
$ —
$ 12
Common collective trusts
—
38
—
38
Cash and cash equivalents total
10
40
—
50
Common collective trusts – domestic
—
222
—
222
Common collective trusts – international
—
197
—
197
Equity securities – domestic
733
—
—
733
Equity securities – international
104
—
—
104
Private equity
—
—
281
281
Equity securities total
837
419
281
1,537
Common collective trusts
—
1,695
—
1,695
Corporate bonds
—
1,319
7
1,326
Swaps
—
415
—
415
Government securities
—
167
—
167
Corporate loans
—
69
5
74
Municipal bonds
—
66
—
66
Mortgage backed securities
—
5
—
5
Other fixed income
—
21
—
21
Fixed income total
—
3,757
12
3,769
Public REITs
100
—
—
100
Private real estate
—
20
153
173
Real estate total
100
20
153
273
Hedge funds
—
—
314
314
Other investments total
—
—
314
314
Total investment assets at fair value
$ 947
$ 4,236
$ 760
$ 5,943
Swaps
$ —
$ (428)
$ —
$ (428)
Other fixed income
(2)
(3)
—
(5)
Fixed income total
(2)
(431)
—
(433)
Total liabilities at fair value
$ (2)
$ (431)
$ —
$ (433)
Accounts payable, net
(36)
Total net assets
$ 5,474
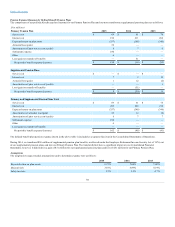
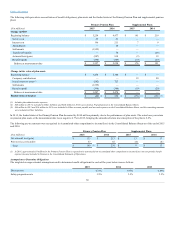
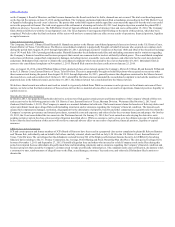
Following is a description of the valuation methodologies used for Primary Pension Plan assets measured at fair value.
– Cash is valued at cost which approximates fair value, and is classified as level 1 of the fair value hierarchy.
Common collective trusts are pools of investments within cash equivalents, equity and fixed income that are benchmarked
relative to a comparable index. They are valued on the basis of the relative interest of each participating investor in the fair value of the underlying assets.
The underlying assets are valued at net asset value (NAV) and are classified as level 2 of the fair value hierarchy.
Equity securities are common stocks and preferred stocks valued based on the price of the security as listed on an open active exchange
and classified as level 1 of the fair value hierarchy, as well as warrants and preferred stock that are valued at a price, which is based on a broker quote in an
over-the-counter market, and are classified as level 2 of the fair value hierarchy.
89