JCPenney 2015 Annual Report Download - page 80
Download and view the complete annual report
Please find page 80 of the 2015 JCPenney annual report below. You can navigate through the pages in the report by either clicking on the pages listed below, or by using the keyword search tool below to find specific information within the annual report.-
 1
1 -
2
-
3
-
4
-
5
-
6
-
7
-
8
-
9
-
10
-
11
-
12
-
13
-
14
-
15
-
16
-
17
-
18
-
19
-
20
-
21
-
22
-
23
-
24
-
25
-
26
-
27
-
28
-
29
-
30
-
31
-
32
-
33
-
34
-
35
-
36
-
37
-
38
-
39
-
40
-
41
-
42
-
43
-
44
-
45
-
46
-
47
-
48
-
49
-
50
-
51
-
52
-
53
-
54
-
55
-
56
-
57
-
58
-
59
-
60
-
61
-
62
-
63
-
64
-
65
-
66
-
67
-
68
-
69
-
 70
70 -
 71
71 -
 72
72 -
 73
73 -
 74
74 -
 75
75 -
 76
76 -
 77
77 -
 78
78 -
 79
79 -
 80
80 -
 81
81 -
 82
82 -
 83
83 -
 84
84 -
 85
85 -
 86
86 -
 87
87 -
 88
88 -
 89
89 -
 90
90 -
91
-
92
-
93
-
94
-
95
-
96
-
97
-
98
-
99
-
100
-
101
-
102
-
103
-
104
-
105
-
106
-
107
-
108
-
109
-
110
-
111
-
112
-
113
-
114
-
115
-
116
-
117
-
118
-
119
-
120
-
121
-
122
-
123
-
124
-
125
-
126
-
127
-
128
-
129
-
130
-
131
-
132
-
133
-
134
-
135
-
136
-
137
-
138
-
139
-
140
-
141
-
142
-
143
-
144
-
145
-
146
-
147
-
148
-
149
-
150
-
151
-
152
-
153
-
154
-
155
-
156
-
157
-
158
-
159
-
160
-
161
-
162
-
163
-
164
-
165
-
166
-
167
-
168
-
169
-
170
-
171
-
172
-
173
-
174
-
175
-
176
-
177
 |
 |

Table of Contents
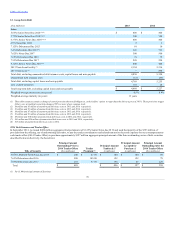
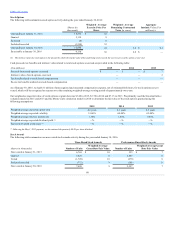
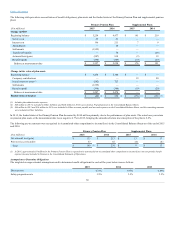
The following table summarizes stock option activity during the year ended January 30, 2016:
Outstanding at January 31, 2015
14,575
$ 32
Granted
5,119
8
Exercised
(4)
8
Forfeited/canceled
(3,594)
32
Outstanding at January 30, 2016
16,096
24
5.2
$ 0.1
Exercisable at January 30, 2016
9,170
36
2.8
$ —
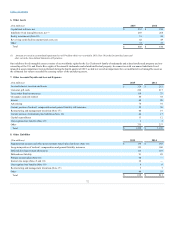
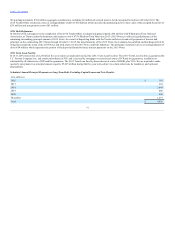
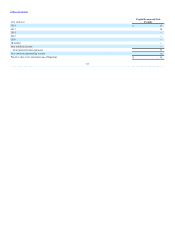
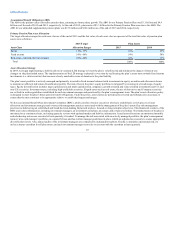
Cash proceeds, tax benefits and intrinsic value related to total stock options exercised are provided in the following table:
Proceeds from stock options exercised
$ —
$ —
$ 7
Intrinsic value of stock options exercised
—
—
2
Tax benefit related to stock-based compensation
—
—
—
Excess tax benefits realized on stock-based compensation
—
—
—
As of January 30, 2016, we had $11 million of unrecognized and unearned compensation expense, net of estimated forfeitures, for stock options not yet
vested, which will be recognized as expense over the remaining weighted-average vesting period of approximately two years.
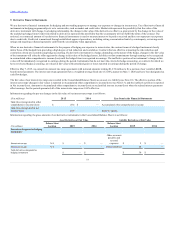
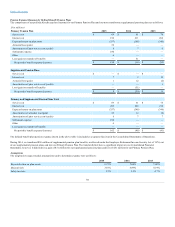
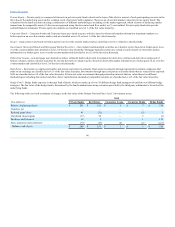
Our weighted-average fair value of stock options at grant date was $3.48 in 2015, $3.78 in 2014 and $7.15 in 2013. We primarily used the binomial lattice
valuation model in 2015 and 2013 and the Monte Carlo simulation model in 2014 to determine the fair value of the stock options granted using the
following assumptions:
Weighted-average expected option term
4.6 years
4.1 years
4.3 years
Weighted-average expected volatility
51.46%
60.00%
62.00%
Weighted-average risk-free interest rate
1.50%
1.60%
0.64%
Weighted-average expected dividend yield (1)
—%
—%
—%
Expected dividend yield range (1)
—%
—%
—%
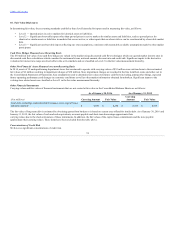
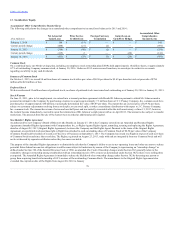
The following table summarizes our non-vested stock awards activity during the year ended January 30, 2016:
Non-vested at January 31, 2015 6,769
$ 10
533
$ 7
Granted 3,429
8
2,403
8
Vested (1,728)
16
(278)
8
Forfeited/canceled (772)
9
(101)
8
Non-vested at January 30, 2016 7,698
9
2,557
7
80