JCPenney 2015 Annual Report Download - page 24
Download and view the complete annual report
Please find page 24 of the 2015 JCPenney annual report below. You can navigate through the pages in the report by either clicking on the pages listed below, or by using the keyword search tool below to find specific information within the annual report.-
 1
1 -
2
-
3
-
4
-
5
-
6
-
7
-
8
-
9
-
10
-
11
-
12
-
13
-
 14
14 -
 15
15 -
 16
16 -
 17
17 -
 18
18 -
 19
19 -
 20
20 -
 21
21 -
 22
22 -
 23
23 -
 24
24 -
 25
25 -
 26
26 -
 27
27 -
 28
28 -
 29
29 -
 30
30 -
 31
31 -
 32
32 -
 33
33 -
 34
34 -
35
-
36
-
37
-
38
-
39
-
40
-
41
-
42
-
43
-
44
-
45
-
46
-
47
-
48
-
49
-
50
-
51
-
52
-
53
-
54
-
55
-
56
-
57
-
58
-
59
-
60
-
61
-
62
-
63
-
64
-
65
-
66
-
67
-
68
-
69
-
70
-
71
-
72
-
73
-
74
-
75
-
76
-
77
-
78
-
79
-
80
-
81
-
82
-
83
-
84
-
85
-
86
-
87
-
88
-
89
-
90
-
91
-
92
-
93
-
94
-
95
-
96
-
97
-
98
-
99
-
100
-
101
-
102
-
103
-
104
-
105
-
106
-
107
-
108
-
109
-
110
-
111
-
112
-
113
-
114
-
115
-
116
-
117
-
118
-
119
-
120
-
121
-
122
-
123
-
124
-
125
-
126
-
127
-
128
-
129
-
130
-
131
-
132
-
133
-
134
-
135
-
136
-
137
-
138
-
139
-
140
-
141
-
142
-
143
-
144
-
145
-
146
-
147
-
148
-
149
-
150
-
151
-
152
-
153
-
154
-
155
-
156
-
157
-
158
-
159
-
160
-
161
-
162
-
163
-
164
-
165
-
166
-
167
-
168
-
169
-
170
-
171
-
172
-
173
-
174
-
175
-
176
-
177
 |
 |

Table of Contents
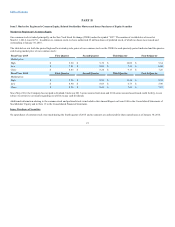
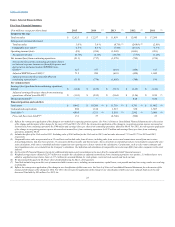
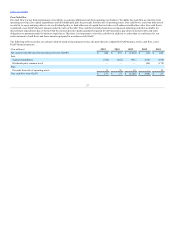
Beginning of year
1,062
1,094
1,104
1,102
1,106
Openings
—
1
—
9(1) 3
Closings
(41)
(33)
(10)
(7) (1) (7)
End of year
1,021
1,062
1,094
1,104
1,102
Gross selling space
104.7
107.9
110.6
111.6
111.2
Sales per gross square foot(2)
$ 120
$ 113
$ 107
$ 116
$ 154
Sales per net selling square foot(2)
$ 165
$ 155
$ 147
$ 161
$ 212
—
—
10
10
10
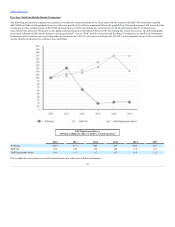
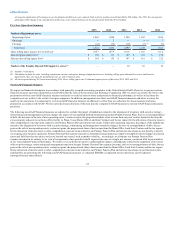
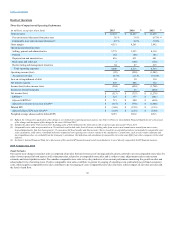
We report our financial information in accordance with generally accepted accounting principles in the United States (GAAP). However, we present certain
financial measures and ratios identified as non-GAAP under the rules of the Securities and Exchange Commission (SEC) to assess our results. We believe the
presentation of these non-GAAP financial measures and ratios is useful in order to better understand our financial performance as well as to facilitate the
comparison of our results to the results of our peer companies. In addition, management uses these non-GAAP financial measures and ratios to assess the
results of our operations. It is important to view non-GAAP financial measures in addition to, rather than as a substitute for, those measures and ratios
prepared in accordance with GAAP. We have provided reconciliations of the most directly comparable GAAP measures to our non-GAAP financial measures
presented.
The following non-GAAP financial measures are adjusted to exclude the impact of markdowns related to the alignment of inventory with our prior strategy,
restructuring and management transition charges, the impact of our qualified defined benefit pension plan (Primary Pension Plan), the loss on extinguishment
of debt, the net gain on the sale of non-operating assets, certain net gains, the proportional share of net income from our joint venture formed to develop the
excess property adjacent to our home office facility in Plano, Texas (Home Office Land Joint Venture) and the tax impact for the allocation of income taxes to
other comprehensive income items related to our Primary Pension Plan and interest rate swaps. Unlike other operating expenses, the impact of the markdowns
related to the alignment of inventory with our prior strategy, restructuring and management transition charges, the loss on extinguishment of debt, the net
gain on the sale of non-operating assets, certain net gains, the proportional share of net income from the Home Office Land Joint Venture and the tax impact
for the allocation of income taxes to other comprehensive income items related to our Primary Pension Plan and interest rate swaps are not directly related to
our ongoing core business operations. Primary Pension Plan expense/(income) is determined using numerous complex assumptions about changes in pension
assets and liabilities that are subject to factors beyond our control, such as market volatility. Accordingly, we eliminate our Primary Pension Plan
expense/(income) in its entirety as we view all components of net periodic benefit expense/(income) as a single, net amount, consistent with its presentation
in our Consolidated Financial Statements. We believe it is useful for investors to understand the impact of markdowns related to the alignment of inventory
with our prior strategy, restructuring and management transition charges, Primary Pension Plan expense/(income), the loss on extinguishment of debt, the net
gain on the sale of non-operating assets, certain net gains, the proportional share of net income from the Home Office Land Joint Venture and the tax impact
for the allocation of income taxes to other comprehensive income items related to our Primary Pension Plan and interest rate swaps on our financial results
and therefore are presenting the following non-GAAP financial measures: (1) adjusted EBITDA; (2) adjusted net income/(loss); and (3) adjusted
earnings/(loss) per share-diluted.
24