JCPenney 2015 Annual Report Download - page 84
Download and view the complete annual report
Please find page 84 of the 2015 JCPenney annual report below. You can navigate through the pages in the report by either clicking on the pages listed below, or by using the keyword search tool below to find specific information within the annual report.-
 1
1 -
2
-
3
-
4
-
5
-
6
-
7
-
8
-
9
-
10
-
11
-
12
-
13
-
14
-
15
-
16
-
17
-
18
-
19
-
20
-
21
-
22
-
23
-
24
-
25
-
26
-
27
-
28
-
29
-
30
-
31
-
32
-
33
-
34
-
35
-
36
-
37
-
38
-
39
-
40
-
41
-
42
-
43
-
44
-
45
-
46
-
47
-
48
-
49
-
50
-
51
-
52
-
53
-
54
-
55
-
56
-
57
-
58
-
59
-
60
-
61
-
62
-
63
-
64
-
65
-
66
-
67
-
68
-
69
-
70
-
71
-
72
-
73
-
 74
74 -
 75
75 -
 76
76 -
 77
77 -
 78
78 -
 79
79 -
 80
80 -
 81
81 -
 82
82 -
 83
83 -
 84
84 -
 85
85 -
 86
86 -
 87
87 -
 88
88 -
 89
89 -
 90
90 -
 91
91 -
 92
92 -
 93
93 -
 94
94 -
95
-
96
-
97
-
98
-
99
-
100
-
101
-
102
-
103
-
104
-
105
-
106
-
107
-
108
-
109
-
110
-
111
-
112
-
113
-
114
-
115
-
116
-
117
-
118
-
119
-
120
-
121
-
122
-
123
-
124
-
125
-
126
-
127
-
128
-
129
-
130
-
131
-
132
-
133
-
134
-
135
-
136
-
137
-
138
-
139
-
140
-
141
-
142
-
143
-
144
-
145
-
146
-
147
-
148
-
149
-
150
-
151
-
152
-
153
-
154
-
155
-
156
-
157
-
158
-
159
-
160
-
161
-
162
-
163
-
164
-
165
-
166
-
167
-
168
-
169
-
170
-
171
-
172
-
173
-
174
-
175
-
176
-
177
 |
 |

Table of Contents
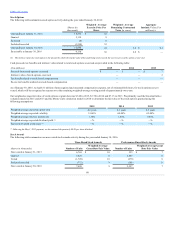
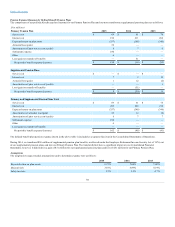
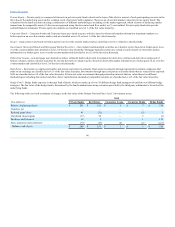
The components of net periodic benefit expense/(income) for our Primary Pension Plan and our non-contributory supplemental pension plans are as follows:
Service cost
$ 69
$ 61
$ 78
Interest cost
196
211
204
Expected return on plan assets
(357)
(348)
(340)
Actuarial loss/(gain)
52
—
—
Amortization of prior service cost/(credit)
8
7
6
Settlement expense
180
—
—
Other
6
—
—
Loss/(gain) on transfer of benefits
—
51
—
Net periodic benefit expense/(income)
$ 154
$ (18)
$ (52)
Service cost
$ —
$ —
$ —
Interest cost
7
9
12
Actuarial loss/(gain)
1
12
(2)
Amortization of prior service cost/(credit)
—
—
1
Loss/(gain) on transfer of benefits
—
(51)
—
Net periodic benefit expense/(income)
$ 8
$ (30)
$ 11
Service cost
$ 69
$ 61
$ 78
Interest cost
203
220
216
Expected return on plan assets
(357)
(348)
(340)
Amortization of actuarial loss/(gain)
53
12
(2)
Amortization of prior service cost/(credit)
8
7
7
Settlement expense
180
—
—
Other
6
—
—
Loss/(gain) on transfer of benefits
—
—
—
Net periodic benefit expense/(income)
$ 162
$ (48)
$ (41)
The defined benefit plan pension expense shown in the above table is included as a separate line item in the Consolidated Statements of Operations.
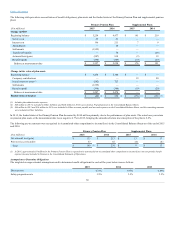
During 2014, we transferred $56 million of supplemental pension plan benefits, as allowed under the Employee Retirement Income Security Act of 1974, out
of our supplemental pension plans and into our Primary Pension Plan. The transfer did not have a significant impact on our Consolidated Financial
Statements; however, it did result in a gain of $51 million for our supplemental pension plans and loss of $51 million for our Primary Pension Plan.
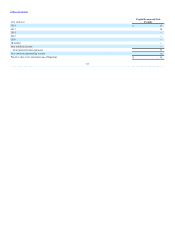
The weighted-average actuarial assumptions used to determine expense were as follows:
Expected return on plan assets 6.75% 7.00% 7.00%
Discount rate 3.87%
4.89%
4.19%
Salary increase 3.5% 3.5% 4.7%
84