JCPenney 2015 Annual Report Download - page 87
Download and view the complete annual report
Please find page 87 of the 2015 JCPenney annual report below. You can navigate through the pages in the report by either clicking on the pages listed below, or by using the keyword search tool below to find specific information within the annual report.-
 1
1 -
2
-
3
-
4
-
5
-
6
-
7
-
8
-
9
-
10
-
11
-
12
-
13
-
14
-
15
-
16
-
17
-
18
-
19
-
20
-
21
-
22
-
23
-
24
-
25
-
26
-
27
-
28
-
29
-
30
-
31
-
32
-
33
-
34
-
35
-
36
-
37
-
38
-
39
-
40
-
41
-
42
-
43
-
44
-
45
-
46
-
47
-
48
-
49
-
50
-
51
-
52
-
53
-
54
-
55
-
56
-
57
-
58
-
59
-
60
-
61
-
62
-
63
-
64
-
65
-
66
-
67
-
68
-
69
-
70
-
71
-
72
-
73
-
74
-
75
-
76
-
 77
77 -
 78
78 -
 79
79 -
 80
80 -
 81
81 -
 82
82 -
 83
83 -
 84
84 -
 85
85 -
 86
86 -
 87
87 -
 88
88 -
 89
89 -
 90
90 -
 91
91 -
 92
92 -
 93
93 -
 94
94 -
 95
95 -
 96
96 -
 97
97 -
98
-
99
-
100
-
101
-
102
-
103
-
104
-
105
-
106
-
107
-
108
-
109
-
110
-
111
-
112
-
113
-
114
-
115
-
116
-
117
-
118
-
119
-
120
-
121
-
122
-
123
-
124
-
125
-
126
-
127
-
128
-
129
-
130
-
131
-
132
-
133
-
134
-
135
-
136
-
137
-
138
-
139
-
140
-
141
-
142
-
143
-
144
-
145
-
146
-
147
-
148
-
149
-
150
-
151
-
152
-
153
-
154
-
155
-
156
-
157
-
158
-
159
-
160
-
161
-
162
-
163
-
164
-
165
-
166
-
167
-
168
-
169
-
170
-
171
-
172
-
173
-
174
-
175
-
176
-
177
 |
 |

Table of Contents
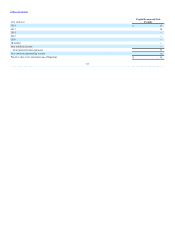
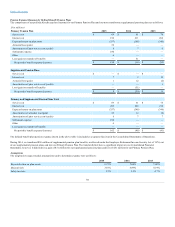
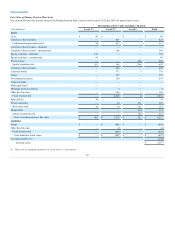
The ABO is the present value of benefits earned to date, assuming no future salary growth. The ABO for our Primary Pension Plan was $3.1 billion and $4.9
billion as of the end of 2015 and 2014, respectively. At the end of 2015, plan assets of $3.3 billion for the Primary Pension Plan were above the ABO. The
ABO for our unfunded supplemental pension plans was $153 million and $166 million as of the end of 2015 and 2014, respectively.
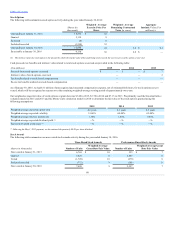
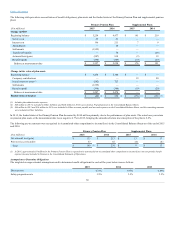
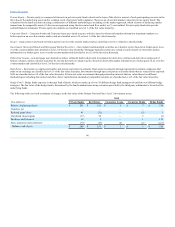
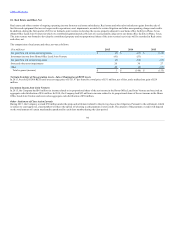
The target allocation ranges for each asset class as of the end of 2015 and the fair value of each asset class as a percent of the total fair value of pension plan
assets were as follows:
Equity
15% - 35%
16%
29%
Fixed income
50% - 60%
54%
58%
Real estate, cash and other investments
20% - 40%
30%
13%
Total
100%
100%
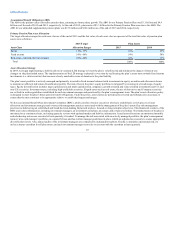
In 2009, we began implementing a liability-driven investment (LDI) strategy to lower the plan’s volatility risk and minimize the impact of interest rate
changes on the plan funded status. The implementation of the LDI strategy is phased in over time by reallocating the plan’s assets more towards fixed income
investments (i.e., debt securities) that are more closely matched in terms of duration to the plan liability.
The plan’s asset portfolio is actively managed and primarily invested in fixed income balanced with investments in equity securities and other asset classes
to maintain an efficient risk/return diversification profile. The risk of loss in the plan’s equity portfolio is mitigated by investing in a broad range of equity
types. Equity diversification includes large-capitalization and small-capitalization companies, growth-oriented and value-oriented investments and U.S. and
non-U.S. securities. Investment types, including high-yield debt securities, illiquid assets such as real estate, the use of derivatives and Company securities
are set forth in written guidelines established for each investment manager and monitored by the plan’s management team. The plan’s asset allocation policy
is designed to meet the plan’s future pension benefit obligations. Under the policy, asset classes are periodically reviewed and rebalanced as necessary, to
ensure that the mix continues to be appropriate relative to established targets and ranges.
We have an internal Benefit Plans Investment Committee (BPIC), which consists of senior executives who have established a review process of asset
allocation and investment strategies and oversee risk management practices associated with the management of the plan’s assets. Key risk management
practices include having an established and broad decision-making framework in place, focused on long-term plan objectives. This framework consists of the
BPIC and various third parties, including investment managers, an investment consultant, an actuary and a trustee/custodian. The funded status of the plan is
monitored on a continuous basis, including quarterly reviews with updated market and liability information. Actual asset allocations are monitored monthly
and rebalancing actions are executed at least quarterly, if needed. To manage the risk associated with an actively managed portfolio, the plan’s management
team reviews each manager’s portfolio on a quarterly basis and has written manager guidelines in place, which are adjusted as necessary to ensure appropriate
diversification levels. Also, annual audits of the investment managers are conducted by independent auditors. Finally, to minimize operational risk, we
utilize a master custodian for all plan assets, and each investment manager reconciles its account with the custodian at least quarterly.
87