JCPenney 2015 Annual Report Download - page 33
Download and view the complete annual report
Please find page 33 of the 2015 JCPenney annual report below. You can navigate through the pages in the report by either clicking on the pages listed below, or by using the keyword search tool below to find specific information within the annual report.-
 1
1 -
2
-
3
-
4
-
5
-
6
-
7
-
8
-
9
-
10
-
11
-
12
-
13
-
14
-
15
-
16
-
17
-
18
-
19
-
20
-
21
-
22
-
 23
23 -
 24
24 -
 25
25 -
 26
26 -
 27
27 -
 28
28 -
 29
29 -
 30
30 -
 31
31 -
 32
32 -
 33
33 -
 34
34 -
 35
35 -
 36
36 -
 37
37 -
 38
38 -
 39
39 -
 40
40 -
 41
41 -
 42
42 -
 43
43 -
44
-
45
-
46
-
47
-
48
-
49
-
50
-
51
-
52
-
53
-
54
-
55
-
56
-
57
-
58
-
59
-
60
-
61
-
62
-
63
-
64
-
65
-
66
-
67
-
68
-
69
-
70
-
71
-
72
-
73
-
74
-
75
-
76
-
77
-
78
-
79
-
80
-
81
-
82
-
83
-
84
-
85
-
86
-
87
-
88
-
89
-
90
-
91
-
92
-
93
-
94
-
95
-
96
-
97
-
98
-
99
-
100
-
101
-
102
-
103
-
104
-
105
-
106
-
107
-
108
-
109
-
110
-
111
-
112
-
113
-
114
-
115
-
116
-
117
-
118
-
119
-
120
-
121
-
122
-
123
-
124
-
125
-
126
-
127
-
128
-
129
-
130
-
131
-
132
-
133
-
134
-
135
-
136
-
137
-
138
-
139
-
140
-
141
-
142
-
143
-
144
-
145
-
146
-
147
-
148
-
149
-
150
-
151
-
152
-
153
-
154
-
155
-
156
-
157
-
158
-
159
-
160
-
161
-
162
-
163
-
164
-
165
-
166
-
167
-
168
-
169
-
170
-
171
-
172
-
173
-
174
-
175
-
176
-
177
 |
 |

Table of Contents
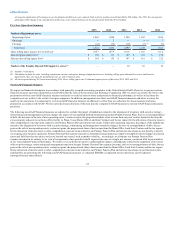
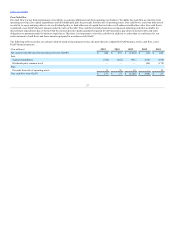
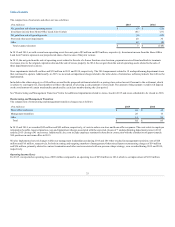
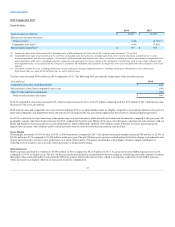
The composition of real estate and other, net was as follows:
Net gain from sale of non-operating assets
$ (9)
$ (25)
Investment income from Home Office Land Joint Venture
(41)
(53)
Net gain from sale of operating assets
(9)
(92)
Store and other asset impairments
20
30
Other
42
(8)
Total expense/(income)
$ 3
$ (148)
In 2015 and 2014, we sold several non-operating assets for a net gain of $9 million and $25 million, respectively. Investment income from the Home Office
Land Joint Venture represents our proportional share of net income of the joint venture.
In 2015, the net gain from the sale of operating assets related to the sale of a former furniture store location, payments received from landlords to terminate
two leases prior to the original expiration date and the sale of excess property. In 2014, the net gain from the sale of operating assets related to the sale of
three department store locations.
Store impairments totaled $- million and $30 million in 2015 and 2014, respectively. The 2014 impairments related to 19 underperforming department stores
that continued to operate. Additionally, in 2015, we incurred an impairment charge related to the write-down of internal use software products that will not be
implemented.
Included in the other category is a $50 million accrual for the proposed settlement related to a pricing class action lawsuit. Pursuant to the settlement, which
is subject to court approval, class members will have the option of selecting a cash payment or store credit. The amount of the payment or credit will depend
on the total amount of certain merchandise purchased by each class member during the class period.
See "Restructuring and Management Transition" below for additional impairments related to stores closed in 2015 and stores scheduled to be closed in 2016.
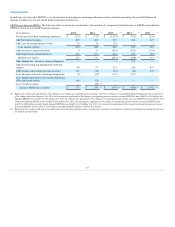
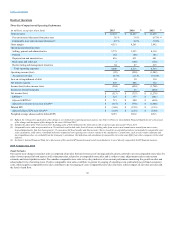
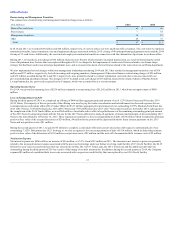
The composition of restructuring and management transition charges was as follows:
Home office and stores
$ 42
$ 45
Management transition
28
16
Other
14
26
Total
$ 84
$ 87
In 2015 and 2014, we recorded $42 million and $45 million, respectively, of costs to reduce our store and home office expenses. The costs relate to employee
termination benefits, lease termination costs and impairment charges associated with the expected closure of 7 underperforming department stores in 2016
and the 2015 closing of 41 such stores. Additionally, the costs include employee termination benefits in connection with the elimination of approximately
300 positions in our home office in 2015.
We also implemented several changes within our management leadership team during 2015 and 2014 that resulted in management transition costs of $28
million and $16 million, respectively, for both incoming and outgoing members of management. Other miscellaneous restructuring charges of $14 million
and $26 million, primarily related to contract termination and other costs associated with our previous shops strategy, were recorded during 2015 and 2014,
respectively.
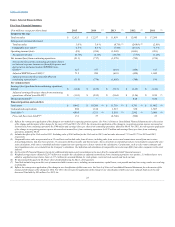
For 2015, we reported an operating loss of $89 million compared to an operating loss of $254 million in 2014, which is an improvement of $165 million.
33