JCPenney 2015 Annual Report Download - page 85
Download and view the complete annual report
Please find page 85 of the 2015 JCPenney annual report below. You can navigate through the pages in the report by either clicking on the pages listed below, or by using the keyword search tool below to find specific information within the annual report.-
 1
1 -
2
-
3
-
4
-
5
-
6
-
7
-
8
-
9
-
10
-
11
-
12
-
13
-
14
-
15
-
16
-
17
-
18
-
19
-
20
-
21
-
22
-
23
-
24
-
25
-
26
-
27
-
28
-
29
-
30
-
31
-
32
-
33
-
34
-
35
-
36
-
37
-
38
-
39
-
40
-
41
-
42
-
43
-
44
-
45
-
46
-
47
-
48
-
49
-
50
-
51
-
52
-
53
-
54
-
55
-
56
-
57
-
58
-
59
-
60
-
61
-
62
-
63
-
64
-
65
-
66
-
67
-
68
-
69
-
70
-
71
-
72
-
73
-
74
-
 75
75 -
 76
76 -
 77
77 -
 78
78 -
 79
79 -
 80
80 -
 81
81 -
 82
82 -
 83
83 -
 84
84 -
 85
85 -
 86
86 -
 87
87 -
 88
88 -
 89
89 -
 90
90 -
 91
91 -
 92
92 -
 93
93 -
 94
94 -
 95
95 -
96
-
97
-
98
-
99
-
100
-
101
-
102
-
103
-
104
-
105
-
106
-
107
-
108
-
109
-
110
-
111
-
112
-
113
-
114
-
115
-
116
-
117
-
118
-
119
-
120
-
121
-
122
-
123
-
124
-
125
-
126
-
127
-
128
-
129
-
130
-
131
-
132
-
133
-
134
-
135
-
136
-
137
-
138
-
139
-
140
-
141
-
142
-
143
-
144
-
145
-
146
-
147
-
148
-
149
-
150
-
151
-
152
-
153
-
154
-
155
-
156
-
157
-
158
-
159
-
160
-
161
-
162
-
163
-
164
-
165
-
166
-
167
-
168
-
169
-
170
-
171
-
172
-
173
-
174
-
175
-
176
-
177
 |
 |

Table of Contents
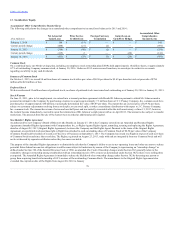
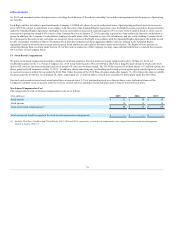
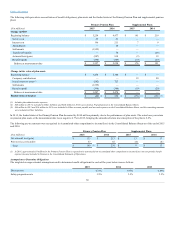
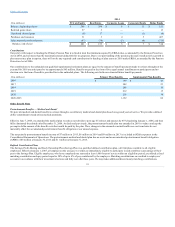
The expected return on plan assets is based on the plan’s long-term asset allocation policy, historical returns for plan assets and overall capital market returns,
taking into account current and expected market conditions.
The discount rate used to measure pension expense each year is the rate as of the beginning of the year (i.e., the prior measurement date). The discount rate
used, determined by the plan actuary, was based on a hypothetical AA yield curve represented by a series of bonds maturing over the next 30 years, designed
to match the corresponding pension benefit cash payments to retirees.
The salary progression rate to measure pension expense was based on age ranges and projected forward.
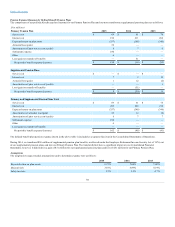
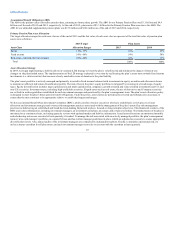
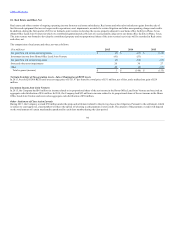
As of the end of 2015, the funded status of the Primary Pension Plan was 99%. The Primary Benefit Obligation (PBO) is the present value of benefits earned to
date by plan participants, including the effect of assumed future salary increases. Under the Employee Retirement Income Security Act of 1974 (ERISA), the
funded status of the plan exceeded 100% as of December 31, 2015 and 2014, the qualified pension plan’s year end.
85