JCPenney 2015 Annual Report Download - page 40
Download and view the complete annual report
Please find page 40 of the 2015 JCPenney annual report below. You can navigate through the pages in the report by either clicking on the pages listed below, or by using the keyword search tool below to find specific information within the annual report.-
 1
1 -
2
-
3
-
4
-
5
-
6
-
7
-
8
-
9
-
10
-
11
-
12
-
13
-
14
-
15
-
16
-
17
-
18
-
19
-
20
-
21
-
22
-
23
-
24
-
25
-
26
-
27
-
28
-
29
-
 30
30 -
 31
31 -
 32
32 -
 33
33 -
 34
34 -
 35
35 -
 36
36 -
 37
37 -
 38
38 -
 39
39 -
 40
40 -
 41
41 -
 42
42 -
 43
43 -
 44
44 -
 45
45 -
 46
46 -
 47
47 -
 48
48 -
 49
49 -
 50
50 -
51
-
52
-
53
-
54
-
55
-
56
-
57
-
58
-
59
-
60
-
61
-
62
-
63
-
64
-
65
-
66
-
67
-
68
-
69
-
70
-
71
-
72
-
73
-
74
-
75
-
76
-
77
-
78
-
79
-
80
-
81
-
82
-
83
-
84
-
85
-
86
-
87
-
88
-
89
-
90
-
91
-
92
-
93
-
94
-
95
-
96
-
97
-
98
-
99
-
100
-
101
-
102
-
103
-
104
-
105
-
106
-
107
-
108
-
109
-
110
-
111
-
112
-
113
-
114
-
115
-
116
-
117
-
118
-
119
-
120
-
121
-
122
-
123
-
124
-
125
-
126
-
127
-
128
-
129
-
130
-
131
-
132
-
133
-
134
-
135
-
136
-
137
-
138
-
139
-
140
-
141
-
142
-
143
-
144
-
145
-
146
-
147
-
148
-
149
-
150
-
151
-
152
-
153
-
154
-
155
-
156
-
157
-
158
-
159
-
160
-
161
-
162
-
163
-
164
-
165
-
166
-
167
-
168
-
169
-
170
-
171
-
172
-
173
-
174
-
175
-
176
-
177
 |
 |

Table of Contents
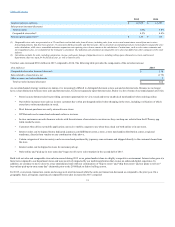
and asset impairments. Overall, the generation of cash from operations was driven primarily by the increase in sales and operating performance of the
Company, including higher margins and better expense control. In addition, during 2015 we received an aggregate cash distribution of $36 million from the
Home Office Land Joint Venture. Cash flows from operating activities also included construction allowances from landlords of $17 million, which provided
additional cash that was used to fund a portion of our capital expenditures in investing activities.
Merchandise inventory increased $69 million to $2,721 million, or 2.6%, as of the end of 2015 compared to $2,652 million as of the end of last year.
Inventory turns for 2015, 2014 and 2013 were 2.65, 2.74 and 2.65 respectively. Merchandise accounts payable decreased $72 million at the end of 2015
compared to 2014.
In 2014, cash flow from operating activities was an inflow of $239 million, an increase of $2,053 million compared to an outflow of $1,814 million during
the prior year. Our net loss as of the end of 2014 of $717 million included significant charges and credits that did not impact operating cash flow, including
depreciation and amortization, certain restructuring and management transition charges, loss on extinguishment of debt, the sale of operating and non-
operating assets and asset impairments. Overall, the generation of cash from operations was driven primarily by the increase in sales and operating
performance of the Company, including higher margins and better expense control. In addition, during 2014 we received an aggregate cash distribution of
$58 million from the Home Office Land Joint Venture of which $53 million was included in operating activities and $5 million was classified as investing
activities as it was considered a return of investment as the aggregate cash distribution exceeded our proportional share of the cumulative earnings of the
joint venture by this amount. Cash flows from operating activities also included construction allowances from landlords of $4 million, which which provided
additional cash that was used to fund a portion of our capital expenditures in investing activities.
In 2015, investing activities was a cash outflow of $296 million compared to an outflow of $142 million for 2014. The increase in the cash outflow from
investing activities was primarily a result of an increase in capital expenditures and a decrease in proceeds from the sale of operating assets.
For 2015, capital expenditures were $320 million. At the end of the year, we also had an additional $13 million of accrued capital expenditures, which will
be paid in subsequent periods. The capital expenditures for 2015 related primarily to the opening of 28 Sephora inside JCPenney stores, investments in
information technology in both our home office and stores and investments in our store environment. We received construction allowances from landlords of
$17 million in 2015, which are classified as operating activities, to fund a portion of the capital expenditures related to store leasehold improvements. These
funds have been recorded as deferred rent credits in the Consolidated Balance Sheets and are amortized as an offset to rent expense.
In 2014, investing activities was a cash outflow of $142 million compared to an outflow of $789 million for 2013. The decrease in the cash outflow from
investing activities was primarily a result of decreased capital expenditures and an increase in proceeds from the sale of operating assets.
For 2014, capital expenditures were $252 million. At the end of the year, we also had an additional $12 million of accrued capital expenditures, which were
paid in 2015. The capital expenditures for 2014 related primarily to the opening of 46 Sephora inside JCPenney stores, the opening of a new department store
in the third quarter of 2014, investments in information technology in both our home office and stores and investments in our store environment. We also
received construction allowances from landlords of $4 million in 2014.
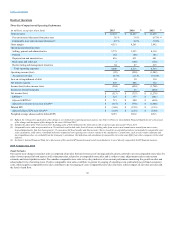
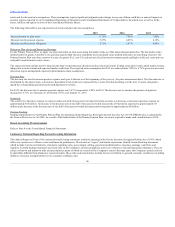
The following provides a breakdown of capital expenditures:
Store renewals and updates $ 170
$ 152
$ 875
Capitalized software 93
39
29
New and relocated stores —
30
10
Technology and other 57
31
37
Total $ 320
$ 252
$ 951
We expect our investment in capital expenditures for 2016 to be approximately $375 million, net of construction allowances from landlords, which will
relate primarily to our store environment, investments in information technology and the continued
40