JCPenney 2015 Annual Report Download - page 35
Download and view the complete annual report
Please find page 35 of the 2015 JCPenney annual report below. You can navigate through the pages in the report by either clicking on the pages listed below, or by using the keyword search tool below to find specific information within the annual report.-
 1
1 -
2
-
3
-
4
-
5
-
6
-
7
-
8
-
9
-
10
-
11
-
12
-
13
-
14
-
15
-
16
-
17
-
18
-
19
-
20
-
21
-
22
-
23
-
24
-
 25
25 -
 26
26 -
 27
27 -
 28
28 -
 29
29 -
 30
30 -
 31
31 -
 32
32 -
 33
33 -
 34
34 -
 35
35 -
 36
36 -
 37
37 -
 38
38 -
 39
39 -
 40
40 -
 41
41 -
 42
42 -
 43
43 -
 44
44 -
 45
45 -
46
-
47
-
48
-
49
-
50
-
51
-
52
-
53
-
54
-
55
-
56
-
57
-
58
-
59
-
60
-
61
-
62
-
63
-
64
-
65
-
66
-
67
-
68
-
69
-
70
-
71
-
72
-
73
-
74
-
75
-
76
-
77
-
78
-
79
-
80
-
81
-
82
-
83
-
84
-
85
-
86
-
87
-
88
-
89
-
90
-
91
-
92
-
93
-
94
-
95
-
96
-
97
-
98
-
99
-
100
-
101
-
102
-
103
-
104
-
105
-
106
-
107
-
108
-
109
-
110
-
111
-
112
-
113
-
114
-
115
-
116
-
117
-
118
-
119
-
120
-
121
-
122
-
123
-
124
-
125
-
126
-
127
-
128
-
129
-
130
-
131
-
132
-
133
-
134
-
135
-
136
-
137
-
138
-
139
-
140
-
141
-
142
-
143
-
144
-
145
-
146
-
147
-
148
-
149
-
150
-
151
-
152
-
153
-
154
-
155
-
156
-
157
-
158
-
159
-
160
-
161
-
162
-
163
-
164
-
165
-
166
-
167
-
168
-
169
-
170
-
171
-
172
-
173
-
174
-
175
-
176
-
177
 |
 |

Table of Contents
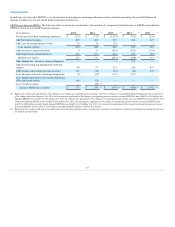
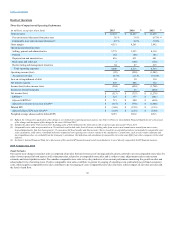
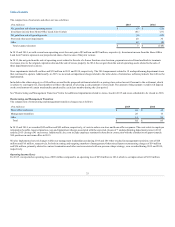
Total net sales () $ 12,257 $ 11,859
Sales percent increase/(decrease)
Total net sales(1) 3.4%
(8.7)% (1)
Comparable store sales(2) 4.4% (7.4)%
Sales per gross square foot(3) $ 113 $ 107
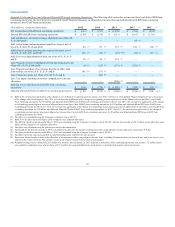
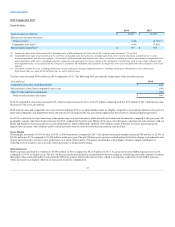
Total net sales increased $398 million in 2014 compared to 2013. The following table provides the components of the net sales increase:
Comparable store sales, including Internet $ 508
Sales related to closed (non-comparable) stores, net (90)
Other revenues and sales adjustments (20)
Total net sales increase/(decrease) $ 398
In 2014, comparable store sales increased 4.4%. Total net sales increased 3.4% to $12,257 million compared with $11,859 million in 2013 and Internet sales
increased 13.4% to $1,225 million.
Both total net sales and comparable store sales increased during 2014 as we gained market share in a highly competitive environment. Internet sales grew at a
faster rate compared to our department stores and were positively impacted by our new mobile application that creates an enhanced digital experience.
For 2014, conversion, average transaction value and average unit retail increased, while the units per transaction decreased as compared to the prior year. All
geographic regions experienced sales increases for 2014 compared to the prior year. During 2014, most of our divisions experienced a sales increase, with our
Home and Women's Accessories divisions, including Sephora, which reflected the addition of 46 Sephora inside JCPenney locations, experiencing the
highest sales increases. Our Children's and Footwear divisions were the only divisions that experienced sales declines.
Gross margin increased to 34.8% of sales in 2014, or 540 basis points, compared to 2013. On a dollar basis, gross margin increased $769 million, or 22.0%, to
$4,261 million in 2014 compared to $3,492 million in the prior year. The net 540 basis point increase resulted primarily from the change in merchandise mix
largely related to better clearance sales performance as a result of fewer units of clearance merchandise sold at higher clearance margins and higher re-
ticketing costs in the prior year as a result of moving back to a promotional strategy.
SG&A expenses declined $121 million to $3,993 million in 2014 compared to $4,114 million in 2013. As a percent of sales, SG&A expenses were 32.6%
compared to 34.7% in the prior year. The net 210 basis point decrease primarily resulted from lower store expenses, advertising costs and corporate overhead
throughout the period and higher income from the JCPenney private label credit card activities, which is recorded as a reduction of our SG&A expenses.
These decreases were slightly offset by an increase in incentive compensation.
35