JCPenney 2015 Annual Report Download - page 168
Download and view the complete annual report
Please find page 168 of the 2015 JCPenney annual report below. You can navigate through the pages in the report by either clicking on the pages listed below, or by using the keyword search tool below to find specific information within the annual report.-
 1
1 -
2
-
3
-
4
-
5
-
6
-
7
-
8
-
9
-
10
-
11
-
12
-
13
-
14
-
15
-
16
-
17
-
18
-
19
-
20
-
21
-
22
-
23
-
24
-
25
-
26
-
27
-
28
-
29
-
30
-
31
-
32
-
33
-
34
-
35
-
36
-
37
-
38
-
39
-
40
-
41
-
42
-
43
-
44
-
45
-
46
-
47
-
48
-
49
-
50
-
51
-
52
-
53
-
54
-
55
-
56
-
57
-
58
-
59
-
60
-
61
-
62
-
63
-
64
-
65
-
66
-
67
-
68
-
69
-
70
-
71
-
72
-
73
-
74
-
75
-
76
-
77
-
78
-
79
-
80
-
81
-
82
-
83
-
84
-
85
-
86
-
87
-
88
-
89
-
90
-
91
-
92
-
93
-
94
-
95
-
96
-
97
-
98
-
99
-
100
-
101
-
102
-
103
-
104
-
105
-
106
-
107
-
108
-
109
-
110
-
111
-
112
-
113
-
114
-
115
-
116
-
117
-
118
-
119
-
120
-
121
-
122
-
123
-
124
-
125
-
126
-
127
-
128
-
129
-
130
-
131
-
132
-
133
-
134
-
135
-
136
-
137
-
138
-
139
-
140
-
141
-
142
-
143
-
144
-
145
-
146
-
147
-
148
-
149
-
150
-
151
-
152
-
153
-
154
-
155
-
156
-
157
-
 158
158 -
 159
159 -
 160
160 -
 161
161 -
 162
162 -
 163
163 -
 164
164 -
 165
165 -
 166
166 -
 167
167 -
 168
168 -
 169
169 -
 170
170 -
 171
171 -
 172
172 -
 173
173 -
 174
174 -
 175
175 -
 176
176 -
 177
177
 |
 |
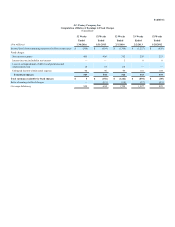
Exhibit 12
J.C. Penney Company, Inc.
Computation of Ratios of Earnings to Fixed Charges
(Unaudited)
52 Weeks
52 Weeks
52 Weeks 53 Weeks
52 Weeks
Ended
Ended
Ended Ended
Ended
($ in millions) 1/30/2016
1/31/2015
2/1/2014 2/2/2013
1/28/2012
Income/(loss) from continuing operations before income taxes $ (504)
$ (694)
$ (1,708) $ (1,227)
$ (428)
Fixed charges:
Net interest expense 405
406
352 226
227
Interest income included in net interest —
—
1 6
8
Loss on extinguishment of debt, bond premiums and
unamortized costs 10
34
114 —
—
Estimated interest within rental expense 94
98
99 101
104
Total fixed charges 509
538
566 333
339
Total earnings available for fixed charges $ 5
$ (156)
$ (1,142) $ (894)
$ (89)
Ratio of earnings to fixed charges —
(0.3)
(2.0)
(2.7)
(0.3)
Coverage deficiency 504
694
1,708
1,227
428