JCPenney 2015 Annual Report Download - page 36
Download and view the complete annual report
Please find page 36 of the 2015 JCPenney annual report below. You can navigate through the pages in the report by either clicking on the pages listed below, or by using the keyword search tool below to find specific information within the annual report.-
 1
1 -
2
-
3
-
4
-
5
-
6
-
7
-
8
-
9
-
10
-
11
-
12
-
13
-
14
-
15
-
16
-
17
-
18
-
19
-
20
-
21
-
22
-
23
-
24
-
25
-
 26
26 -
 27
27 -
 28
28 -
 29
29 -
 30
30 -
 31
31 -
 32
32 -
 33
33 -
 34
34 -
 35
35 -
 36
36 -
 37
37 -
 38
38 -
 39
39 -
 40
40 -
 41
41 -
 42
42 -
 43
43 -
 44
44 -
 45
45 -
 46
46 -
47
-
48
-
49
-
50
-
51
-
52
-
53
-
54
-
55
-
56
-
57
-
58
-
59
-
60
-
61
-
62
-
63
-
64
-
65
-
66
-
67
-
68
-
69
-
70
-
71
-
72
-
73
-
74
-
75
-
76
-
77
-
78
-
79
-
80
-
81
-
82
-
83
-
84
-
85
-
86
-
87
-
88
-
89
-
90
-
91
-
92
-
93
-
94
-
95
-
96
-
97
-
98
-
99
-
100
-
101
-
102
-
103
-
104
-
105
-
106
-
107
-
108
-
109
-
110
-
111
-
112
-
113
-
114
-
115
-
116
-
117
-
118
-
119
-
120
-
121
-
122
-
123
-
124
-
125
-
126
-
127
-
128
-
129
-
130
-
131
-
132
-
133
-
134
-
135
-
136
-
137
-
138
-
139
-
140
-
141
-
142
-
143
-
144
-
145
-
146
-
147
-
148
-
149
-
150
-
151
-
152
-
153
-
154
-
155
-
156
-
157
-
158
-
159
-
160
-
161
-
162
-
163
-
164
-
165
-
166
-
167
-
168
-
169
-
170
-
171
-
172
-
173
-
174
-
175
-
176
-
177
 |
 |

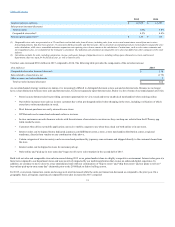
Table of Contents
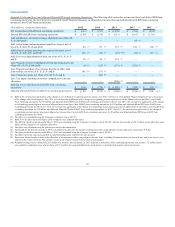
Our private label credit card and co-branded MasterCard® programs are owned and serviced by Synchrony Financial (Synchrony). Under our agreement with
Synchrony, we receive cash payments from Synchrony based upon the performance of the credit card portfolio. We participate in the programs by providing
marketing promotions designed to increase the use of each card, including enhanced marketing offers for cardholders. Additionally, we accept payments in
our stores from cardholders who prefer to pay in person when they are shopping in our locations. The income we earn under our agreement with Synchrony is
included as an offset to SG&A expenses. For 2014 and 2013, we recognized income of $313 million and $306 million, respectively, pursuant to our
agreement with Synchrony.
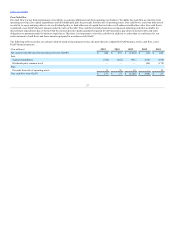
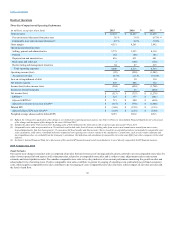
Pension expense provided below reflects the retrospective application of the change in our method of recognizing pension expense. See Note 3 of Notes to
Consolidated Financial Statements for a discussion of the change and the impact of the change for the years 2014 and 2013.
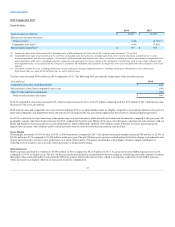
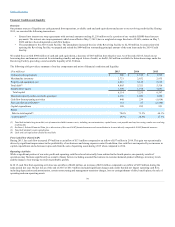
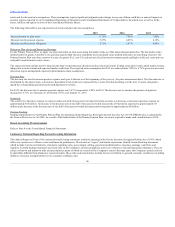
Primary pension plan expense/(income)
$ (18)
$ (52)
Supplemental pension plans expense/(income)
(30)
11
Total pension expense/(income)
$ (48)
$ (41)
Total pension expense, which consists of our Primary Pension Plan expense and our supplemental pension plans expense, resulted in pension income in 2014
and 2013 as a result of the expected return on plan assets exceeding the pension costs respectively for each year. Additionally, the MTM Adjustment was $12
million in expense in 2014 and $2 million in income in 2013.
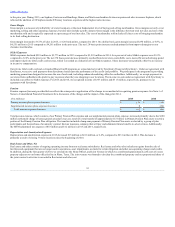
Depreciation and amortization expense in 2014 increased $30 million to $631 million, or 5.0%, compared to $601 million in 2013. This increase is a result
of our investment and replacement of store fixtures in connection with the implementation of our prior strategy. Depreciation and amortization expense for
2013 excluded $37 million of increased depreciation as a result of shortening the useful lives of department store fixtures that were replaced during 2013
with the build out of our home department and other attractions. These amounts were included in the line Restructuring and management transition in the
Consolidated Statements of Operations.
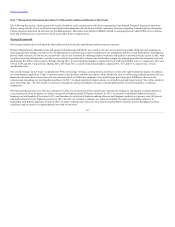
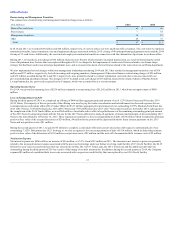
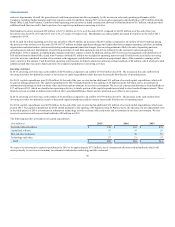
The composition of real estate and other, net was as follows:
Net gain from sale of non-operating assets
$ (25)
$ (132)
Investment income from Home Office Land Joint Venture
(53)
—
Net gain from sale of operating assets
(92)
(17)
Store and other asset impairments
30
27
Other
(8)
(33)
Total expense/(income)
$ (148)
$ (155)
In 2014, we sold several non-operating assets for a net gain of $25 million. In 2013, we sold REIT investments and three joint venture investments for a total
net gain of $132 million. Investment income from the Home Office Land Joint Venture represents our proportional share of net income of the joint venture.
In 2014, the net gain from the sale of operating assets related to the sale of three department store locations. In 2013, we had a gain on the sale of our
leasehold interest of a former department store location.
Store impairments totaled $30 million and $27 million in 2014 and 2013, respectively. The 2014 and 2013 impairments related to 19 and 25
underperforming department stores, respectively, that continued to operate. In addition, in 2013, we recorded a $9 million impairment charge for our
ownership of the U.S. and Puerto Rico rights of the monet® trade name.
See "Restructuring and Management Transition" below for additional impairments related to store closures.
36