JCPenney 2015 Annual Report Download - page 66
Download and view the complete annual report
Please find page 66 of the 2015 JCPenney annual report below. You can navigate through the pages in the report by either clicking on the pages listed below, or by using the keyword search tool below to find specific information within the annual report.-
 1
1 -
2
-
3
-
4
-
5
-
6
-
7
-
8
-
9
-
10
-
11
-
12
-
13
-
14
-
15
-
16
-
17
-
18
-
19
-
20
-
21
-
22
-
23
-
24
-
25
-
26
-
27
-
28
-
29
-
30
-
31
-
32
-
33
-
34
-
35
-
36
-
37
-
38
-
39
-
40
-
41
-
42
-
43
-
44
-
45
-
46
-
47
-
48
-
49
-
50
-
51
-
52
-
53
-
54
-
55
-
 56
56 -
 57
57 -
 58
58 -
 59
59 -
 60
60 -
 61
61 -
 62
62 -
 63
63 -
 64
64 -
 65
65 -
 66
66 -
 67
67 -
 68
68 -
 69
69 -
 70
70 -
 71
71 -
 72
72 -
 73
73 -
 74
74 -
 75
75 -
 76
76 -
77
-
78
-
79
-
80
-
81
-
82
-
83
-
84
-
85
-
86
-
87
-
88
-
89
-
90
-
91
-
92
-
93
-
94
-
95
-
96
-
97
-
98
-
99
-
100
-
101
-
102
-
103
-
104
-
105
-
106
-
107
-
108
-
109
-
110
-
111
-
112
-
113
-
114
-
115
-
116
-
117
-
118
-
119
-
120
-
121
-
122
-
123
-
124
-
125
-
126
-
127
-
128
-
129
-
130
-
131
-
132
-
133
-
134
-
135
-
136
-
137
-
138
-
139
-
140
-
141
-
142
-
143
-
144
-
145
-
146
-
147
-
148
-
149
-
150
-
151
-
152
-
153
-
154
-
155
-
156
-
157
-
158
-
159
-
160
-
161
-
162
-
163
-
164
-
165
-
166
-
167
-
168
-
169
-
170
-
171
-
172
-
173
-
174
-
175
-
176
-
177
 |
 |

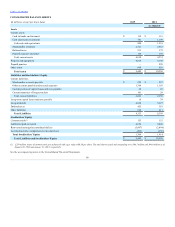
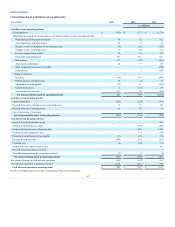
Table of Contents
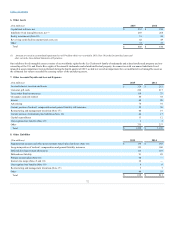
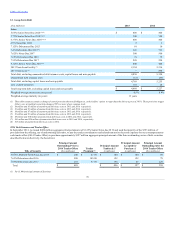
(Years)
Land
N/A
$ 272
$ 274
Buildings
50
4,877
4,899
Furniture and equipment
3-20
2,064
2,175
Leasehold improvements(1)
1,244
1,301
Capital leases (equipment)
3-5
116
116
Accumulated depreciation
(3,757)
(3,617)
Property and equipment, net
$ 4,816
$ 5,148
Property and equipment is stated at cost less accumulated depreciation. Depreciation is computed primarily by using the straight-line method over the
estimated useful lives of the related assets.
We expense routine maintenance and repairs when incurred. We capitalize major replacements and improvements. We remove the cost of assets sold or retired
and the related accumulated depreciation or amortization from the accounts and include any resulting gain or loss in net income/(loss).
We recognize a liability for the fair value of our conditional asset retirement obligations, which are primarily related to asbestos removal, when incurred if the
liability’s fair value can be reasonably estimated.
We capitalize costs associated with the acquisition or development of major software for internal use in other assets in our Consolidated Balance Sheets and
amortize the asset over the expected useful life of the software, generally between three and seven years. We only capitalize subsequent additions,
modifications or upgrades to internal-use software to the extent that such changes allow the software to perform a task it previously did not perform. We
expense software maintenance and training costs as incurred.
We evaluate long-lived assets such as store property and equipment and other corporate assets for impairment whenever events or changes in circumstances
indicate that the carrying amount of those assets may not be recoverable. Factors considered important that could trigger an impairment review include, but
are not limited to, significant underperformance relative to historical or projected future operating results and significant changes in the manner of use of the
assets or our overall business strategies. Potential impairment exists if the estimated undiscounted cash flows expected to result from the use of the asset plus
any net proceeds expected from disposition of the asset are less than the carrying value of the asset. The amount of the impairment loss represents the excess
of the carrying value of the asset over its fair value and is included in Real estate and other, net in the Consolidated Statements of Operations. We estimate
fair value based on either a projected discounted cash flow method using a discount rate that is considered commensurate with the risk inherent in our current
business model or appraised value, as appropriate. We also take other factors into consideration in estimating the fair value of our stores, such as local market
conditions, operating environment, mall performance and other trends.
We assess the recoverability of indefinite-lived intangible assets at least annually during the fourth quarter of our fiscal year or whenever events or changes in
circumstances indicate that the carrying amount of the indefinite-lived intangible asset may not be fully recoverable. Examples of a change in events or
circumstances include, but are not limited to, a decrease in the market price of the asset, a history of cash flow losses related to the use of the asset or a
significant adverse change in the extent or manner in which an asset is being used. We test our indefinite-lived intangible assets utilizing the relief from
royalty method to determine the estimated fair value for each indefinite-lived intangible asset. The relief from royalty method estimates our theoretical
royalty savings from ownership of the intangible asset. Key assumptions used in this model include discount rates, royalty rates, growth rates, sales
projections and terminal value rates.
66