JCPenney 2015 Annual Report Download - page 22
Download and view the complete annual report
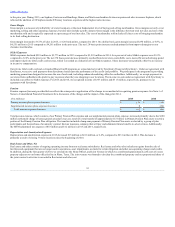
Please find page 22 of the 2015 JCPenney annual report below. You can navigate through the pages in the report by either clicking on the pages listed below, or by using the keyword search tool below to find specific information within the annual report.-
 1
1 -
2
-
3
-
4
-
5
-
6
-
7
-
8
-
9
-
10
-
11
-
 12
12 -
 13
13 -
 14
14 -
 15
15 -
 16
16 -
 17
17 -
 18
18 -
 19
19 -
 20
20 -
 21
21 -
 22
22 -
 23
23 -
 24
24 -
 25
25 -
 26
26 -
 27
27 -
 28
28 -
 29
29 -
 30
30 -
 31
31 -
 32
32 -
33
-
34
-
35
-
36
-
37
-
38
-
39
-
40
-
41
-
42
-
43
-
44
-
45
-
46
-
47
-
48
-
49
-
50
-
51
-
52
-
53
-
54
-
55
-
56
-
57
-
58
-
59
-
60
-
61
-
62
-
63
-
64
-
65
-
66
-
67
-
68
-
69
-
70
-
71
-
72
-
73
-
74
-
75
-
76
-
77
-
78
-
79
-
80
-
81
-
82
-
83
-
84
-
85
-
86
-
87
-
88
-
89
-
90
-
91
-
92
-
93
-
94
-
95
-
96
-
97
-
98
-
99
-
100
-
101
-
102
-
103
-
104
-
105
-
106
-
107
-
108
-
109
-
110
-
111
-
112
-
113
-
114
-
115
-
116
-
117
-
118
-
119
-
120
-
121
-
122
-
123
-
124
-
125
-
126
-
127
-
128
-
129
-
130
-
131
-
132
-
133
-
134
-
135
-
136
-
137
-
138
-
139
-
140
-
141
-
142
-
143
-
144
-
145
-
146
-
147
-
148
-
149
-
150
-
151
-
152
-
153
-
154
-
155
-
156
-
157
-
158
-
159
-
160
-
161
-
162
-
163
-
164
-
165
-
166
-
167
-
168
-
169
-
170
-
171
-
172
-
173
-
174
-
175
-
176
-
177
 |
 |
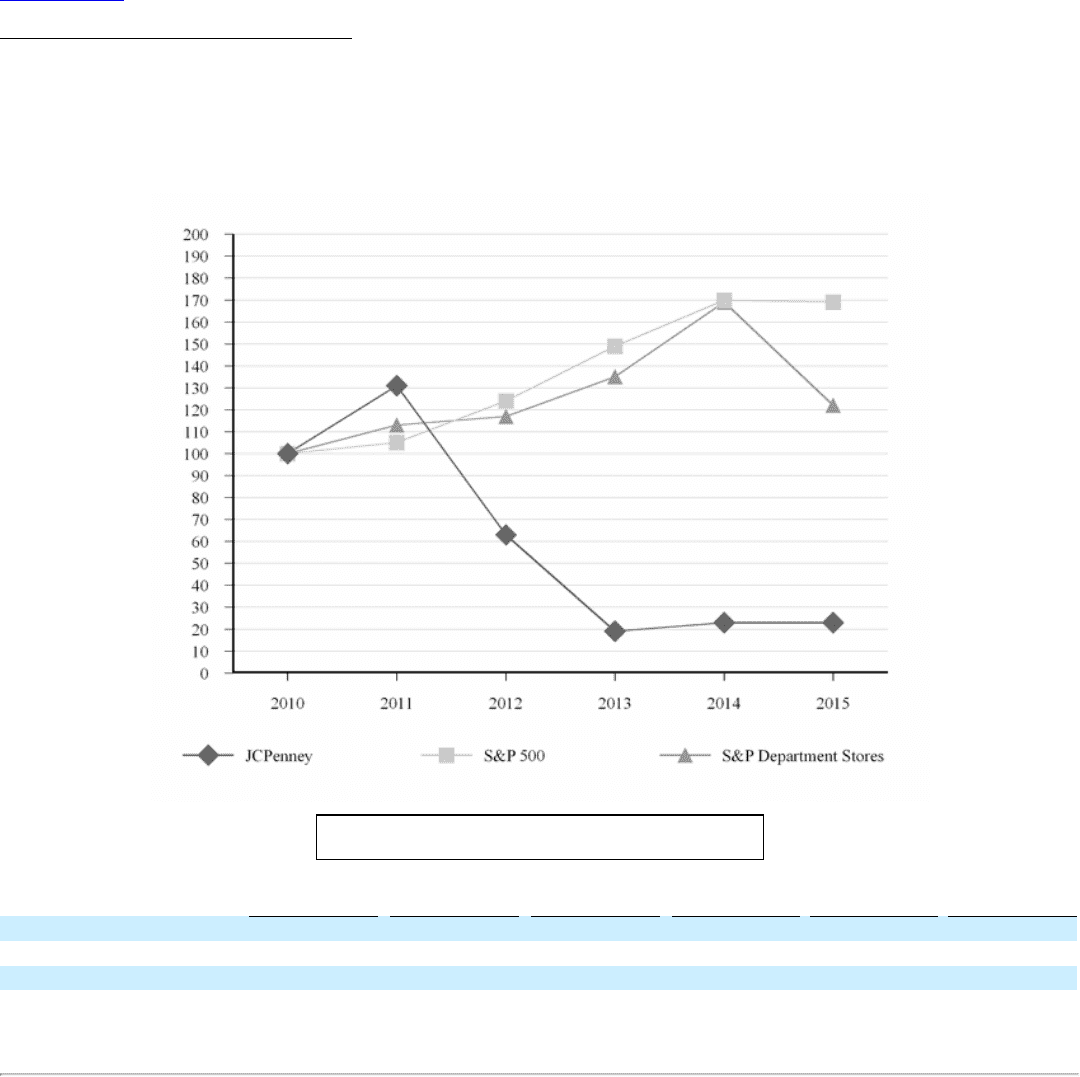
Table of Contents
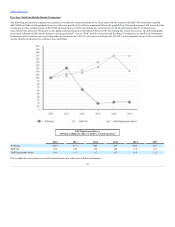
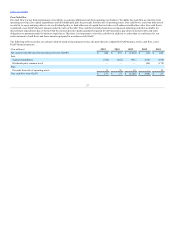
The following presentation compares our cumulative stockholder returns for the past five fiscal years with the returns of the S&P 500 Stock Index and the
S&P 500 Retail Index for Department Stores over the same period. A list of these companies follows the graph below. The graph assumes $100 invested at the
closing price of our common stock on the NYSE and each index as of the last trading day of our fiscal year 2010 and assumes that all dividends were
reinvested on the date paid. The points on the graph represent fiscal year-end amounts based on the last trading day of each fiscal year. The following graph
and related information shall not be deemed “soliciting material” or to be “filed” with the Securities and Exchange Commission, nor shall such information
be incorporated by reference into any filing under the Securities Act of 1933 or Securities Exchange Act of 1934, each as amended, except to the extent that
we specifically incorporate it by reference into such filing.
JCPenney
$100
$131
$63
$19
$23
$23
S&P 500
100
105
124
149
170
169
S&P Department Stores
100
113
117
135
169
122
The stockholder returns shown are neither determinative nor indicative of future performance.
22