JCPenney 2015 Annual Report Download - page 58
Download and view the complete annual report
Please find page 58 of the 2015 JCPenney annual report below. You can navigate through the pages in the report by either clicking on the pages listed below, or by using the keyword search tool below to find specific information within the annual report.-
 1
1 -
2
-
3
-
4
-
5
-
6
-
7
-
8
-
9
-
10
-
11
-
12
-
13
-
14
-
15
-
16
-
17
-
18
-
19
-
20
-
21
-
22
-
23
-
24
-
25
-
26
-
27
-
28
-
29
-
30
-
31
-
32
-
33
-
34
-
35
-
36
-
37
-
38
-
39
-
40
-
41
-
42
-
43
-
44
-
45
-
46
-
47
-
 48
48 -
 49
49 -
 50
50 -
 51
51 -
 52
52 -
 53
53 -
 54
54 -
 55
55 -
 56
56 -
 57
57 -
 58
58 -
 59
59 -
 60
60 -
 61
61 -
 62
62 -
 63
63 -
 64
64 -
 65
65 -
 66
66 -
 67
67 -
 68
68 -
69
-
70
-
71
-
72
-
73
-
74
-
75
-
76
-
77
-
78
-
79
-
80
-
81
-
82
-
83
-
84
-
85
-
86
-
87
-
88
-
89
-
90
-
91
-
92
-
93
-
94
-
95
-
96
-
97
-
98
-
99
-
100
-
101
-
102
-
103
-
104
-
105
-
106
-
107
-
108
-
109
-
110
-
111
-
112
-
113
-
114
-
115
-
116
-
117
-
118
-
119
-
120
-
121
-
122
-
123
-
124
-
125
-
126
-
127
-
128
-
129
-
130
-
131
-
132
-
133
-
134
-
135
-
136
-
137
-
138
-
139
-
140
-
141
-
142
-
143
-
144
-
145
-
146
-
147
-
148
-
149
-
150
-
151
-
152
-
153
-
154
-
155
-
156
-
157
-
158
-
159
-
160
-
161
-
162
-
163
-
164
-
165
-
166
-
167
-
168
-
169
-
170
-
171
-
172
-
173
-
174
-
175
-
176
-
177
 |
 |

Table of Contents
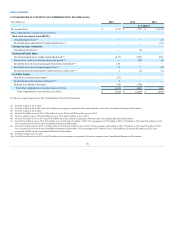
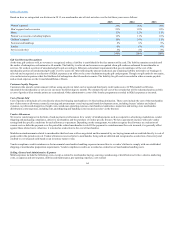
Total net sales
$ 12,625
$ 12,257
$ 11,859
Cost of goods sold
8,074
7,996
8,367
Gross margin
4,551
4,261
3,492
Operating expenses/(income):
Selling, general and administrative (SG&A)
3,775
3,993
4,114
Pension
162
(48)
(41)
Depreciation and amortization
616
631
601
Real estate and other, net
3
(148)
(155)
Restructuring and management transition
84
87
215
Total operating expenses
4,640
4,515
4,734
Operating income/(loss)
(89)
(254)
(1,242)
Loss on extinguishment of debt
10
34
114
Net interest expense
405
406
352
Income/(loss) before income taxes
(504)
(694)
(1,708)
Income tax expense/(benefit)
9
23
(430)
Net income/(loss)
$ (513)
$ (717)
$ (1,278)
Earnings/(loss) per share:
Basic
$ (1.68)
$ (2.35)
$ (5.13)
Diluted
(1.68)
(2.35)
(5.13)
Weighted average shares – basic
305.9
305.2
249.3
Weighted average shares – diluted
305.9
305.2
249.3
58