JCPenney 2015 Annual Report Download - page 32
Download and view the complete annual report
Please find page 32 of the 2015 JCPenney annual report below. You can navigate through the pages in the report by either clicking on the pages listed below, or by using the keyword search tool below to find specific information within the annual report.-
 1
1 -
2
-
3
-
4
-
5
-
6
-
7
-
8
-
9
-
10
-
11
-
12
-
13
-
14
-
15
-
16
-
17
-
18
-
19
-
20
-
21
-
 22
22 -
 23
23 -
 24
24 -
 25
25 -
 26
26 -
 27
27 -
 28
28 -
 29
29 -
 30
30 -
 31
31 -
 32
32 -
 33
33 -
 34
34 -
 35
35 -
 36
36 -
 37
37 -
 38
38 -
 39
39 -
 40
40 -
 41
41 -
 42
42 -
43
-
44
-
45
-
46
-
47
-
48
-
49
-
50
-
51
-
52
-
53
-
54
-
55
-
56
-
57
-
58
-
59
-
60
-
61
-
62
-
63
-
64
-
65
-
66
-
67
-
68
-
69
-
70
-
71
-
72
-
73
-
74
-
75
-
76
-
77
-
78
-
79
-
80
-
81
-
82
-
83
-
84
-
85
-
86
-
87
-
88
-
89
-
90
-
91
-
92
-
93
-
94
-
95
-
96
-
97
-
98
-
99
-
100
-
101
-
102
-
103
-
104
-
105
-
106
-
107
-
108
-
109
-
110
-
111
-
112
-
113
-
114
-
115
-
116
-
117
-
118
-
119
-
120
-
121
-
122
-
123
-
124
-
125
-
126
-
127
-
128
-
129
-
130
-
131
-
132
-
133
-
134
-
135
-
136
-
137
-
138
-
139
-
140
-
141
-
142
-
143
-
144
-
145
-
146
-
147
-
148
-
149
-
150
-
151
-
152
-
153
-
154
-
155
-
156
-
157
-
158
-
159
-
160
-
161
-
162
-
163
-
164
-
165
-
166
-
167
-
168
-
169
-
170
-
171
-
172
-
173
-
174
-
175
-
176
-
177
 |
 |

Table of Contents
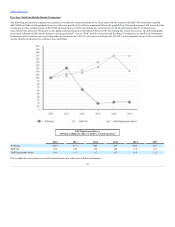
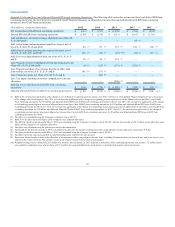
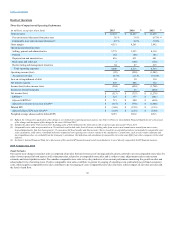
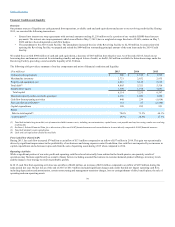
to the prior year. During 2015, our Sephora, Footwear and Handbags, Home, and Men's merchandise divisions experienced sales increases. Sephora, which
reflected the addition of 28 Sephora inside JCPenney locations, experienced the highest sales increase.
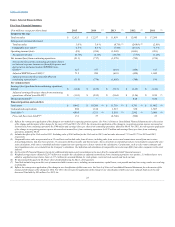
Gross margin is a measure of profitability of a retail company at the most fundamental level of buying and selling merchandise. Gross margins not only cover
marketing, selling and other operating expenses, but also must include a profit element. Gross margin is the difference between total net sales and cost of the
merchandise sold and is typically expressed as a percentage of total net sales. The cost of merchandise sold includes all direct costs of bringing merchandise
to its final selling destination.
Gross margin increased to 36.0% of sales in 2015, or 120 basis points, compared to 2014. On a dollar basis, gross margin increased $290 million, or 6.8%, to
$4,551 million in 2015 compared to $4,261 million in the prior year. The net 120 basis point increase resulted primarily from improved margins on our
clearance merchandise.
SG&A expenses declined $218 million to $3,775 million in 2015 compared to $3,993 million in 2014. As a percent of sales, SG&A expenses were 29.9%
compared to 32.6% in the prior year. The net 270 basis point decrease primarily resulted from lower store controllable costs, more efficient advertising spend
and improved private label credit card revenue, which is recorded as a reduction of our SG&A expenses. These decreases were partially offset by an increase
in incentive compensation.
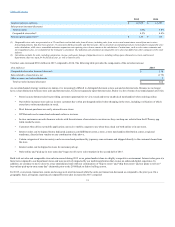
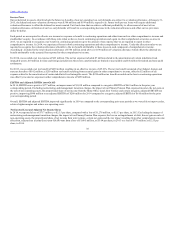
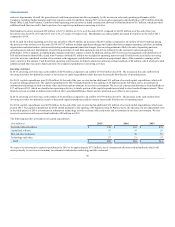
Our private label credit card and co-branded MasterCard® programs are owned and serviced by Synchrony Financial (Synchrony). Under our agreement with
Synchrony, we receive cash payments from Synchrony based upon the performance of the credit card portfolio. We participate in the programs by providing
marketing promotions designed to increase the use of each card, including enhanced marketing offers for cardholders. Additionally, we accept payments in
our stores from cardholders who prefer to pay in person when they are shopping in our locations. The income we earn under our agreement with Synchrony is
included as an offset to SG&A expenses. For 2015 and 2014, we recognized income of $367 million and $313 million, respectively, pursuant to our
agreement with Synchrony.
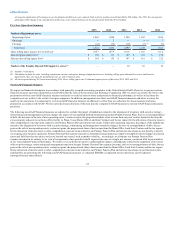
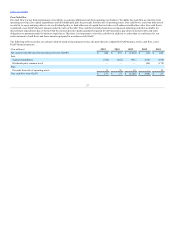
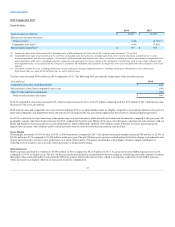
Pension expense/(income) provided below reflects the retrospective application of the change in our method of recognizing pension expense. See Note 3 of
Notes to Consolidated Financial Statements for a discussion of the change and the impact of the change for 2014.
Primary pension plan expense/(income)
$ 154
$ (18)
Supplemental pension plans expense/(income)
8
(30)
Total pension expense/(income)
$ 162
$ (48)
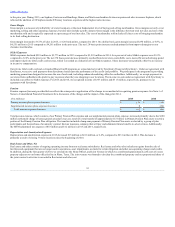
Total pension expense, which consists of our Primary Pension Plan expense and our supplemental pension plans expense, increased primarily due to the $180
million settlement charge of unrecognized actuarial losses as a result of a total transfer of approximately $1.5 billion in Primary Pension Plan assets to settle a
portion of the Primary Pension Plan obligation. The transfers included a lump-sum payment of Primary Pension Plan assets as elected by a group of plan
participants and the purchase of an annuity contract from an insurance company that will pay and administer future benefits to select retirees. Additionally,
the MTM adjustment was expense of $53 million and $12 million in 2015 and 2014, respectively.
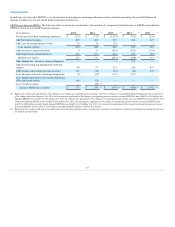
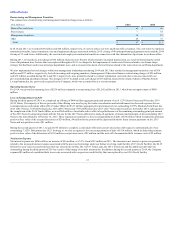
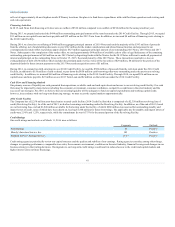
Depreciation and amortization expense in 2015 decreased $15 million to $616 million, or 2.4%, compared to $631 million in 2014. This decrease is
primarily a result of closing 74 store locations since the beginning of 2014.
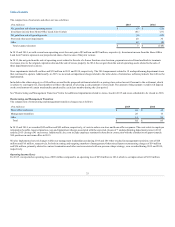
Real estate and other consists of ongoing operating income from our real estate subsidiaries. Real estate and other also includes net gains from the sale of
facilities and equipment that are no longer used in operations, asset impairments, accruals for certain litigation and other non-operating charges and credits.
In addition, during the first quarter of 2014, we entered into the Home Office Land Joint Venture in which we contributed approximately 220 acres of excess
property adjacent to our home office facility in Plano, Texas. The joint venture was formed to develop the contributed property and our proportional share of
the joint venture's activities is recorded in Real estate and other, net.
32