JCPenney 2015 Annual Report Download - page 39
Download and view the complete annual report
Please find page 39 of the 2015 JCPenney annual report below. You can navigate through the pages in the report by either clicking on the pages listed below, or by using the keyword search tool below to find specific information within the annual report.-
 1
1 -
2
-
3
-
4
-
5
-
6
-
7
-
8
-
9
-
10
-
11
-
12
-
13
-
14
-
15
-
16
-
17
-
18
-
19
-
20
-
21
-
22
-
23
-
24
-
25
-
26
-
27
-
28
-
 29
29 -
 30
30 -
 31
31 -
 32
32 -
 33
33 -
 34
34 -
 35
35 -
 36
36 -
 37
37 -
 38
38 -
 39
39 -
 40
40 -
 41
41 -
 42
42 -
 43
43 -
 44
44 -
 45
45 -
 46
46 -
 47
47 -
 48
48 -
 49
49 -
50
-
51
-
52
-
53
-
54
-
55
-
56
-
57
-
58
-
59
-
60
-
61
-
62
-
63
-
64
-
65
-
66
-
67
-
68
-
69
-
70
-
71
-
72
-
73
-
74
-
75
-
76
-
77
-
78
-
79
-
80
-
81
-
82
-
83
-
84
-
85
-
86
-
87
-
88
-
89
-
90
-
91
-
92
-
93
-
94
-
95
-
96
-
97
-
98
-
99
-
100
-
101
-
102
-
103
-
104
-
105
-
106
-
107
-
108
-
109
-
110
-
111
-
112
-
113
-
114
-
115
-
116
-
117
-
118
-
119
-
120
-
121
-
122
-
123
-
124
-
125
-
126
-
127
-
128
-
129
-
130
-
131
-
132
-
133
-
134
-
135
-
136
-
137
-
138
-
139
-
140
-
141
-
142
-
143
-
144
-
145
-
146
-
147
-
148
-
149
-
150
-
151
-
152
-
153
-
154
-
155
-
156
-
157
-
158
-
159
-
160
-
161
-
162
-
163
-
164
-
165
-
166
-
167
-
168
-
169
-
170
-
171
-
172
-
173
-
174
-
175
-
176
-
177
 |
 |
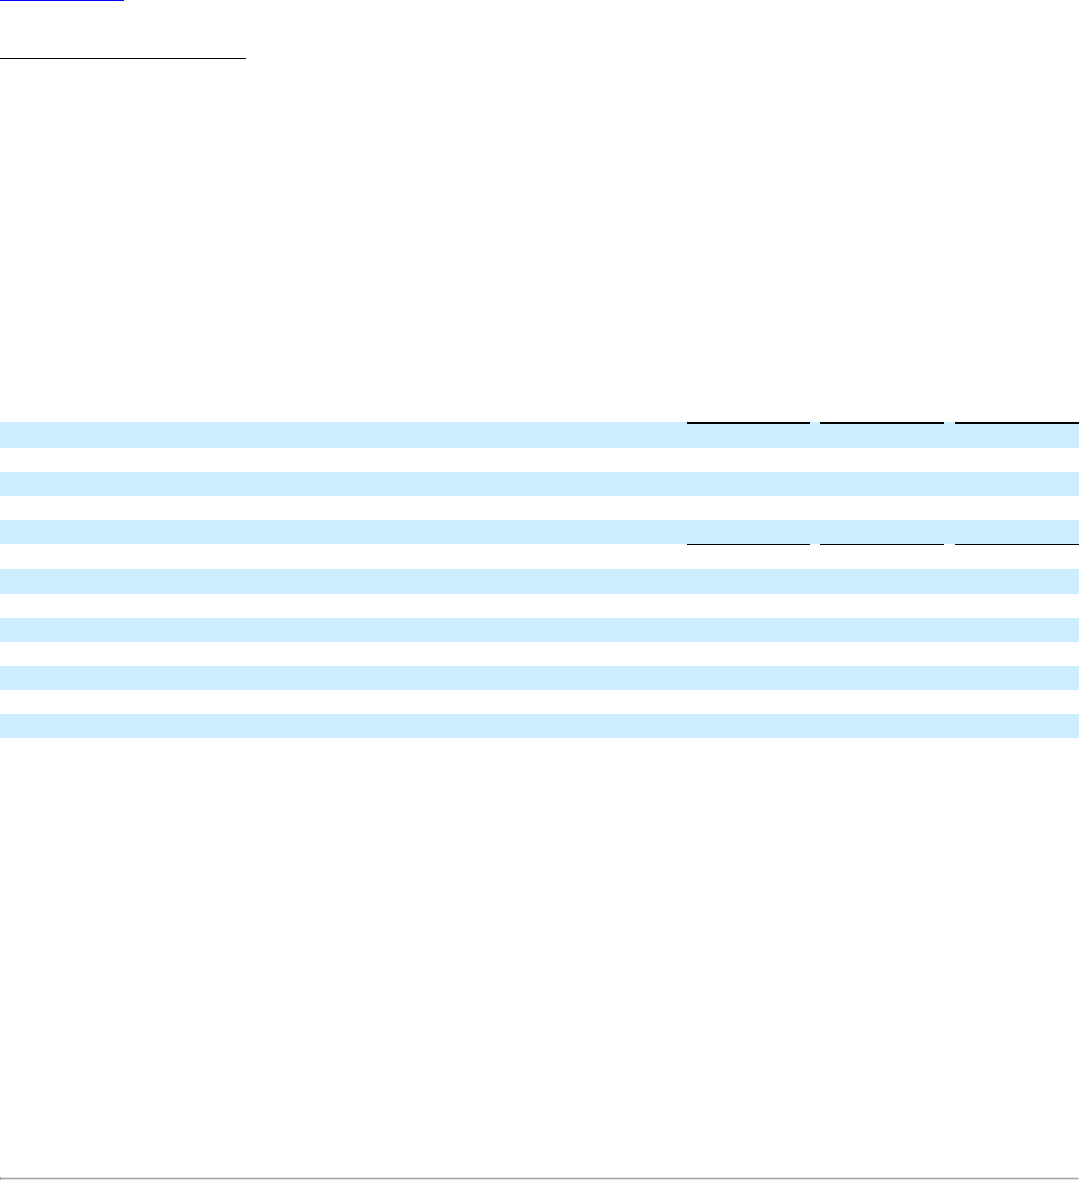
Table of Contents
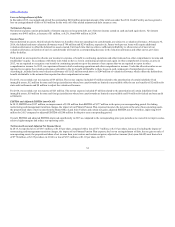
Our primary sources of liquidity are cash generated from operations, available cash and cash equivalents and access to our revolving credit facility. During
2015, we executed the following transactions:
•Entered into interest rate swap agreements with notional amounts totaling $1,250 million to fix a portion of our variable LIBOR-based interest
payments. The interest rate swap agreements, which were effective May 7, 2015, have a weighted-average fixed rate of 2.04%, mature on May 7,
2020 and have been designated as cash flow hedges.
• The amendment to the 2014 Credit Facility. The amendment increased the size of the Revolving Facility to $2,350 million. In connection with
upsizing the Revolving Facility, we prepaid and retired the $494 million outstanding principal amount of the term loan under the 2014 Credit
Facility.
We ended the year with $900 million of cash and cash equivalents, a decrease of $418 million from the prior year. As of the end of 2015, based on our
borrowing base and amounts reserved for outstanding standby and import letters of credit, we had$1,568 million available for future borrowings under the
Revolving Facility, providing a total available liquidity of $2.5 billion.
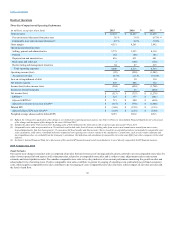
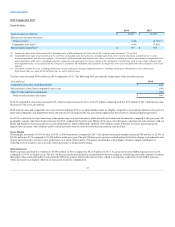
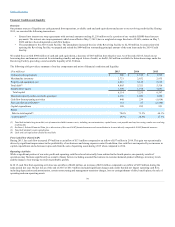
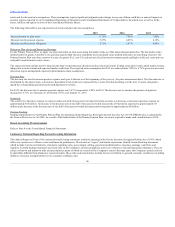
The following table provides a summary of our key components and ratios of financial condition and liquidity:
Cash and cash equivalents $ 900 $ 1,318
$ 1,515
Merchandise inventory 2,721 2,652
2,935
Property and equipment, net 4,816 5,148
5,619
Total debt(1) 4,805 5,321
5,510
Stockholders’ equity 1,309 1,914
3,087
Total capital 6,114 7,235
8,597
Maximum capacity under our credit agreement 2,350
1,850
1,850
Cash flow from operating activities 440 239
(1,814)
Free cash flow (non-GAAP)(2) 131 57
(2,746)
Capital expenditures 320 252
951
Ratios:
Debt-to-total capital(3) 78.6% 73.5%
64.1%
Cash-to-debt(4) 18.7% 24.8%
27.5%
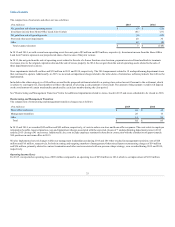
During 2015, free cash flow increased $74 million to an inflow of $131 million compared to an inflow of $57 million in 2014. This gain was operationally
driven by significant improvement in the profitability of our business and strong expense control. In addition, free cash flow was impacted by an increase in
capital expenditures and a decrease in proceeds from the sale of operating assets during 2015 when compared to 2014.
While a significant portion of our sales, profit and operating cash flows have historically been realized in the fourth quarter, our quarterly results of
operations may fluctuate significantly as a result of many factors, including seasonal fluctuations in customer demand, product offerings, inventory levels
and the impact of our strategy to return to profitable growth.
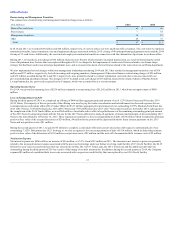
In 2015, cash flow from operating activities was an inflow of $440 million, an increase of $201 million compared to an inflow of $239 million during the
same period last year. Our net loss as of the end of 2015 of $513 million included significant charges and credits that did not impact operating cash flow,
including depreciation and amortization, certain restructuring and management transition charges, loss on extinguishment of debt, benefit plans, the sale of
operating and non-operating assets
39