JCPenney 2015 Annual Report Download - page 62
Download and view the complete annual report
Please find page 62 of the 2015 JCPenney annual report below. You can navigate through the pages in the report by either clicking on the pages listed below, or by using the keyword search tool below to find specific information within the annual report.-
 1
1 -
2
-
3
-
4
-
5
-
6
-
7
-
8
-
9
-
10
-
11
-
12
-
13
-
14
-
15
-
16
-
17
-
18
-
19
-
20
-
21
-
22
-
23
-
24
-
25
-
26
-
27
-
28
-
29
-
30
-
31
-
32
-
33
-
34
-
35
-
36
-
37
-
38
-
39
-
40
-
41
-
42
-
43
-
44
-
45
-
46
-
47
-
48
-
49
-
50
-
51
-
 52
52 -
 53
53 -
 54
54 -
 55
55 -
 56
56 -
 57
57 -
 58
58 -
 59
59 -
 60
60 -
 61
61 -
 62
62 -
 63
63 -
 64
64 -
 65
65 -
 66
66 -
 67
67 -
 68
68 -
 69
69 -
 70
70 -
 71
71 -
 72
72 -
73
-
74
-
75
-
76
-
77
-
78
-
79
-
80
-
81
-
82
-
83
-
84
-
85
-
86
-
87
-
88
-
89
-
90
-
91
-
92
-
93
-
94
-
95
-
96
-
97
-
98
-
99
-
100
-
101
-
102
-
103
-
104
-
105
-
106
-
107
-
108
-
109
-
110
-
111
-
112
-
113
-
114
-
115
-
116
-
117
-
118
-
119
-
120
-
121
-
122
-
123
-
124
-
125
-
126
-
127
-
128
-
129
-
130
-
131
-
132
-
133
-
134
-
135
-
136
-
137
-
138
-
139
-
140
-
141
-
142
-
143
-
144
-
145
-
146
-
147
-
148
-
149
-
150
-
151
-
152
-
153
-
154
-
155
-
156
-
157
-
158
-
159
-
160
-
161
-
162
-
163
-
164
-
165
-
166
-
167
-
168
-
169
-
170
-
171
-
172
-
173
-
174
-
175
-
176
-
177
 |
 |

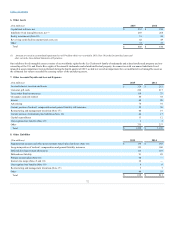
Table of Contents
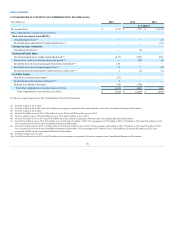
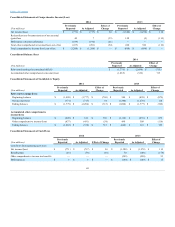
Net income/(loss) $ (513)
$ (717)
$ (1,278)
Adjustments to reconcile net income/(loss) to net cash provided by/(used in) operating activities:
Restructuring and management transition 10
32
132
Asset impairments and other charges 25
39
30
Net gain on sale or redemption of non-operating assets (9)
(25)
(132)
Net gain on sale of operating assets (9)
(92)
(17)
Loss on extinguishment of debt 10
34
114
Depreciation and amortization 616
631
601
Benefit plans 127
(78)
(108)
Stock-based compensation 44
33
28
Other comprehensive income tax benefits —
—
(250)
Deferred taxes —
3
(149)
Change in cash from:
Inventory (69)
283
(594)
Prepaid expenses and other assets 19
(1)
74
Merchandise accounts payable (72)
49
(214)
Current income taxes 4
(10)
50
Accrued expenses and other 257
58
(101)
440
239
(1,814)
Capital expenditures (320)
(252)
(951)
Proceeds from sale or redemption of non-operating assets 13
35
143
Proceeds from sale of operating assets 11
70
19
Joint venture return of investment —
5
—
(296)
(142)
(789)
Proceeds from short-term borrowings —
—
850
Payment on short-term borrowings —
(650)
(200)
Net proceeds from issuance of long-term debt —
893
2,180
Premium on early retirement of debt —
(33)
(110)
Payments of capital leases and note payable (33)
(26)
(29)
Payments of long-term debt (520)
(412)
(256)
Financing costs (4)
(65)
(31)
Net proceeds from common stock issued —
—
786
Proceeds from stock options exercised —
—
7
Tax withholding payments for vested restricted stock (5)
(1)
(9)
(562)
(294)
3,188
Net increase/(decrease) in cash and cash equivalents (418)
(197)
585
Cash and cash equivalents at beginning of period 1,318
1,515
930
$ 900
$ 1,318
$ 1,515
62