GameStop 2014 Annual Report Download - page 96
Download and view the complete annual report
Please find page 96 of the 2014 GameStop annual report below. You can navigate through the pages in the report by either clicking on the pages listed below, or by using the keyword search tool below to find specific information within the annual report.-
 1
1 -
2
-
3
-
4
-
5
-
6
-
7
-
8
-
9
-
10
-
11
-
12
-
13
-
14
-
15
-
16
-
17
-
18
-
19
-
20
-
21
-
22
-
23
-
24
-
25
-
26
-
27
-
28
-
29
-
30
-
31
-
32
-
33
-
34
-
35
-
36
-
37
-
38
-
39
-
40
-
41
-
42
-
43
-
44
-
45
-
46
-
47
-
48
-
49
-
50
-
51
-
52
-
53
-
54
-
55
-
56
-
57
-
58
-
59
-
60
-
61
-
62
-
63
-
64
-
65
-
66
-
67
-
68
-
69
-
70
-
71
-
72
-
73
-
74
-
75
-
76
-
77
-
78
-
79
-
80
-
81
-
82
-
83
-
84
-
85
-
 86
86 -
 87
87 -
 88
88 -
 89
89 -
 90
90 -
 91
91 -
 92
92 -
 93
93 -
 94
94 -
 95
95 -
 96
96 -
 97
97 -
 98
98 -
 99
99 -
 100
100 -
 101
101 -
 102
102 -
 103
103 -
 104
104 -
 105
105 -
 106
106 -
107
-
108
-
109
-
110
-
111
-
112
-
113
-
114
 |
 |

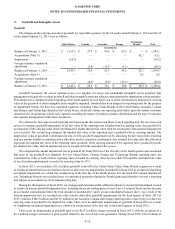
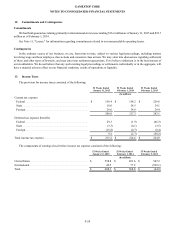
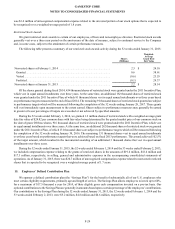
9. Goodwill and Intangible Assets
Goodwill
The changes in the carrying amount of goodwill, by reportable segment, for the 52 weeks ended February 1, 2014 and the 52
weeks ended January 31, 2015 were as follows:
United States Canada Australia Europe
Technology
Brands Total
(In millions)
Balance at February 3, 2013 ............... $1,153.5 $37.7$ 96.6 $95.3$ —$ 1,383.1
Acquisitions (Note 3) .......................... ————62.1 62.1
Impairment .......................................... (10.2) ————(10.2)
Foreign currency translation
adjustment ........................................... —(3.9)(15.3)(1.1)—(20.3)
Balance at February 1, 2014 ............... 1,143.333.881.394.262.11,414.7
Acquisitions (Note 3) .......................... ————4.54.5
Foreign currency translation
adjustment ........................................... —(4.3)(9.2)(15.3)—(28.8)
Balance at January 31, 2015 ............... $1,143.3 $29.5$ 72.1 $78.9$ 66.6 $1,390.4
Goodwill represents the excess purchase price over tangible net assets and identifiable intangible assets acquired. Our
management is required to evaluate goodwill and other intangible assets not subject to amortization for impairment at least annually.
This annual test is completed at the beginning of the fourth quarter of each fiscal year or when circumstances indicate the carrying
value of the goodwill or other intangible assets might be impaired. Goodwill has been assigned to reporting units for the purpose
of impairment testing. We have five operating segments, including VideoGame Brands in the United States, Australia, Canada
and Europe, and Technology Brands in the United States, which also define our reporting units based upon the similar economic
characteristics of operations within each segment, including the nature of products, product distribution and the type of customer
and separate management within these businesses.
We estimate the fair value of each reporting unit based on the discounted cash flows of each reporting unit. We useatwo-step
process to measure goodwill impairment. If the fair value of the reporting unit is higher than its carrying value, then goodwill is
not impaired. If the carrying value of the reporting unit is higher than the fair value, then the second step of the goodwill impairment
test is needed. The second step compares the implied fair value of the reporting unit’s goodwill with its carrying amount. The
implied fair value of goodwill is determined in step 2ofthe goodwill impairment test by allocating the fair value of the reporting
unit in amanner similar to apurchase price allocation used in abusiness combination. Any residual fair value after this allocation
represents the implied fair value of the reporting unit's goodwill. If the carrying amount of the reporting unit’s goodwill exceeds
the implied fair value, then an impairment loss is recognized in the amount of the excess.
We completed the annual impairment test of goodwill for fiscal 2014 as of the first day of the fourth quarter and concluded
that none of our goodwill was impaired. For our United States, Canada, Europe and Technology Brands reporting units, the
concluded fair value of each of these reporting units exceeded its carrying value by more than 30% and the concluded fair value
of our Australia reporting unit exceeded its carryingvalue by 15%.
In fiscal 2013, we recorded a$10.2 million goodwill write-offinthe United States VideoGame Brands segment as aresult
of exiting an immaterial non-core business; however,there were no impairments of goodwill in fiscal 2013 as aresultofcompleting
our annual impairment test, which was conducted as of the first day of the fourth quarter.For thefiscal 2013 annual impairment
test, Technology Brands was excluded since it commenced operations during the fourth quarter and therefore was not areporting
unit subject to assessment as of our annual testing date.
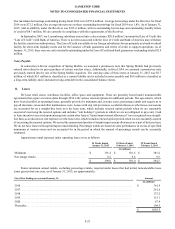
During the third quarter of fiscal 2012, our management determined that sufficient indicators of potential impairment existed
to require an interim goodwill impairment test, including the recent trading prices of our Class ACommon Stock and the decrease
in our market capitalization below the total amount of stockholders’ equity on our consolidated balance sheet. As aresultofthe
interim impairment test, we recorded non-cash, non-tax deductible goodwill impairments for the third quarter of fiscal 2012 of
$107.1 million, $100.3 million and $419.6 million in our Australia, Canada and Europe reporting units, respectively,toreduce the
carrying value of goodwill to its implied fair value. There were no additional impairments of goodwill in fiscal 2012 as aresult
of completing our annual impairment test, which was conducted as of the first day of the fourth quarter of fiscal 2012.
There were no impairments to goodwill prior to the $627.0 million charge recorded in fiscal 2012, with the exception of a
$3.3 million charge recorded in aprior period related to the exit of non-core operations. During fiscal 2013, $10.2 million of
GAMESTOP CORP.
NOTES TO CONSOLIDATED FINANCIAL STATEMENTS
F-19