GameStop 2014 Annual Report Download - page 108
Download and view the complete annual report
Please find page 108 of the 2014 GameStop annual report below. You can navigate through the pages in the report by either clicking on the pages listed below, or by using the keyword search tool below to find specific information within the annual report.-
 1
1 -
2
-
3
-
4
-
5
-
6
-
7
-
8
-
9
-
10
-
11
-
12
-
13
-
14
-
15
-
16
-
17
-
18
-
19
-
20
-
21
-
22
-
23
-
24
-
25
-
26
-
27
-
28
-
29
-
30
-
31
-
32
-
33
-
34
-
35
-
36
-
37
-
38
-
39
-
40
-
41
-
42
-
43
-
44
-
45
-
46
-
47
-
48
-
49
-
50
-
51
-
52
-
53
-
54
-
55
-
56
-
57
-
58
-
59
-
60
-
61
-
62
-
63
-
64
-
65
-
66
-
67
-
68
-
69
-
70
-
71
-
72
-
73
-
74
-
75
-
76
-
77
-
78
-
79
-
80
-
81
-
82
-
83
-
84
-
85
-
86
-
87
-
88
-
89
-
90
-
91
-
92
-
93
-
94
-
95
-
96
-
97
-
 98
98 -
 99
99 -
 100
100 -
 101
101 -
 102
102 -
 103
103 -
 104
104 -
 105
105 -
 106
106 -
 107
107 -
 108
108 -
 109
109 -
 110
110 -
 111
111 -
 112
112 -
 113
113 -
 114
114
 |
 |

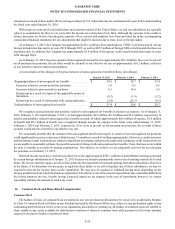
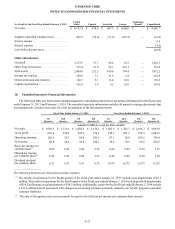
Segment results for Europe include retail operations in 10 European countries and e-commerce operations in five countries. The
Technology Brands segment includes retail operations in the United States. We measure segment profit using operating earnings,
which is defined as income from continuing operations before intercompany royalty fees, net interest expense and income taxes.
Transactions between reportable segments consist primarily of royalties, management fees, intersegment loans and related interest.
There were no intersegment sales during the 52 weeks ended January 31, 2015, the 52 weeks ended February 1, 2014 or the 53
weeks ended February 2, 2013.
Information on segments and the reconciliation of segment profit to earnings (loss) before income taxes are as follows (in
millions):
As of and for the Fiscal Year Ended January 31, 2015
United
States Canada Australia Europe
Technology
Brands Consolidated
Net sales ........................................................... $6,193.5 $476.4 $644.7 $1,652.8 $328.6 $9,296.0
Segment operating earnings ............................. 483.228.338.035.932.9618.3
Interest income ................................................. 0.7
Interest expense ................................................ (10.7)
Earnings before income taxes .......................... 608.3
Other Information:
Goodwill........................................................... 1,143.329.572.178.966.61,390.4
Other long-lived assets ..................................... 328.618.446.4214.1 185.9793.4
Total assets ....................................................... 2,740.3252.1 382.5527.2 344.24,246.3
Income tax expense (benefit) ........................... 198.14.2 8.4(6.7)11.2 215.2
Depreciation and amortization ......................... 102.53.8 9.630.87.7 154.4
Capital expenditures......................................... 92.3 5.111.219.931.1159.6
As of and for the Fiscal Year Ended February 1, 2014
United
States Canada Australia Europe
Technology
Brands Consolidated
Net sales........................................................... $6,160.4 $468.8 $613.7 $1,733.8 $62.8 $9,039.5
Segment operating earnings (loss)................... 465.326.637.544.3(0.2)573.5
Interest income ................................................ 0.9
Interest expense ............................................... (5.6)
Earning before income taxes ........................... 568.8
Other Information:
Goodwill .......................................................... 1,143.333.881.394.262.11,414.7
Other long-lived assets .................................... 320.020.840.4269.3 76.6 727.1
Total assets....................................................... 2,320.7228.7 389.2972.2 180.64,091.4
Income tax expense ......................................... 173.211.68.8 21.0 —214.6
Depreciation and amortization ........................ 115.44.4 10.5 35.3 0.9166.5
Capital expenditures ........................................ 85.7 6.96.7 21.4 4.9125.6
GAMESTOP CORP.
NOTES TO CONSOLIDATED FINANCIAL STATEMENTS
F-31