GameStop 2014 Annual Report Download - page 67
Download and view the complete annual report
Please find page 67 of the 2014 GameStop annual report below. You can navigate through the pages in the report by either clicking on the pages listed below, or by using the keyword search tool below to find specific information within the annual report.-
 1
1 -
2
-
3
-
4
-
5
-
6
-
7
-
8
-
9
-
10
-
11
-
12
-
13
-
14
-
15
-
16
-
17
-
18
-
19
-
20
-
21
-
22
-
23
-
24
-
25
-
26
-
27
-
28
-
29
-
30
-
31
-
32
-
33
-
34
-
35
-
36
-
37
-
38
-
39
-
40
-
41
-
42
-
43
-
44
-
45
-
46
-
47
-
48
-
49
-
50
-
51
-
52
-
53
-
54
-
55
-
56
-
 57
57 -
 58
58 -
 59
59 -
 60
60 -
 61
61 -
 62
62 -
 63
63 -
 64
64 -
 65
65 -
 66
66 -
 67
67 -
 68
68 -
 69
69 -
 70
70 -
 71
71 -
 72
72 -
 73
73 -
 74
74 -
 75
75 -
 76
76 -
 77
77 -
78
-
79
-
80
-
81
-
82
-
83
-
84
-
85
-
86
-
87
-
88
-
89
-
90
-
91
-
92
-
93
-
94
-
95
-
96
-
97
-
98
-
99
-
100
-
101
-
102
-
103
-
104
-
105
-
106
-
107
-
108
-
109
-
110
-
111
-
112
-
113
-
114
 |
 |

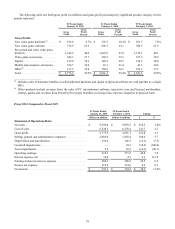
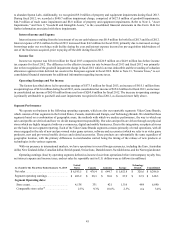
Europe
Segment results for Europe included retail operations in 11 European countries and e-commerce operations in six countries.
For the 52 weeks ended February 1, 2014, European net sales increased 7.8% compared to the 53 weeks ended February 2, 2013.
This increase in net sales was partially due to the impact of changes in exchange rates in fiscal 2013, which had the effect of
increasing sales by $57.0 million when compared to fiscal 2012, as well as an increase in comparable store sales of 3.2%, partially
offset by additional sales in the 53rd week of fiscal 2012 when compared to fiscal 2013. The increase in net sales at existing stores
was primarily due to new video game console and title launches.
The segment operating profit was $44.3 million for fiscal 2013 compared to an operating loss of $397.5 million for fiscal
2012. The increase in operating earnings was primarily due to asset impairment charges of $4.7 million recognized during fiscal
2013 compared to charges totaling $467.0 million for goodwill and asset impairments during fiscal 2012, partially offset by the
impact of adecline in sales prior to the launch of the next generation consoles in fiscal 2013 and the impact of low margin consoles
as apercentageoftotal sales, as well as the impact of the operating earnings in the 53rdweek in fiscal 2012.
48
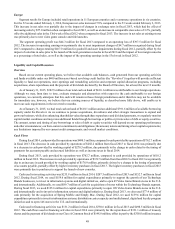
Liquidity and Capital Resources
Overview
Based on our current operating plans, we believe that available cash balances, cash generated from our operating activities
and funds available under our $400 million asset-based revolving credit facility (the “Revolver”) together will provide sufficient
liquidity to fund our operations, store openings and remodeling activities and corporate capital allocation programs, including
acquisitions, share repurchases and the payment of dividends declared by the Board of Directors, for at least the next 12 months.
As of January 31, 2015, $382.5 million of our total cash on hand of $610.1 million was attributable to our foreign operations.
Although we may,fromtime to time, evaluate strategies and alternatives with respect to the cash attributable to our foreign
operations, we currently anticipate that this cash will remain in those foreign jurisdictions and it therefore may not be available
for immediate use; however,webelieve that our existing sources of liquidity,asdescribed more fully above, will enable us to
meet our cash requirements inthe next twelve months.
As of January 31, 2015, we had total cash on hand of $610.1 million and an additional $391.6 million of available borrowing
capacity under the Revolver.Aswecontinue to pursue acquisitions, divestitures and other strategic transactions to expand and
grow our business, while also enhancing shareholder value through share repurchases and dividend payments, we regularly monitor
capital market conditions and may raise additional funds through borrowings or public or private sales of debt or equity securities.
The amount, nature and timing of any borrowings or sales of debt or equity securities will depend on our operating performance
and other circumstances; our then-current commitments and obligations; the amount, nature and timing of our capital requirements;
any limitations imposed by our currentcredit arrangements; and overall market conditions.
Cash Flows
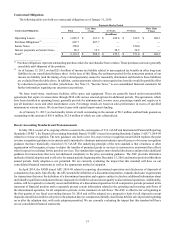
During fiscal 2014, cash provided by operations was $480.5 million, compared to cash provided by operations of $762.7 million
in fiscal 2013. The decrease in cash provided by operations of $282.2 million from fiscal 2013 to fiscal 2014 was primarily due
to adecrease in cash provided by working capital of $278.3 million, due primarily to the change in cash related to the timing of
payments for accountspayable and accrued liabilities as well as income taxes in fiscal 2014.
During fiscal 2013, cash provided by operations was $762.7 million, compared to cash provided by operations of $610.2
million infiscal 2012. The increase in cash provided by operations of $152.5 million from fiscal 2012 to fiscal 2013 was primarily
due to an increase in cash provided by working capital of $176.9 million, primarily driven by achangeinthe timing of payments
of accounts payable, partially offset by higher inventory purchases in fiscal 2013. The higher inventory purchases in fiscal 2013
were primarily due to purchases tosupport the launch of new consoles.
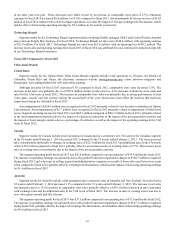
Cash used in investing activities was $235.9 million in fiscal 2014, $207.5 million in fiscal 2013 and $152.7 million in fiscal
2012. During fiscal 2014, we used $159.6 million for capital expenditures primarily to support the growth of our Technology
Brands businesses, to invest in information systems and digital initiatives, and to open 49 VideoGame Brandsstores in the U.S.
and internationally.Additionally,weused $89.7 million of cash for acquisitions of stores within the Technology Brands segment.
During fiscal 2013, we used $125.6 million for capital expenditures primarily to open 109 VideoGame Brands stores in the U.S.
and internationally and to invest in information systems and digital initiatives. During fiscal 2013, we also used $77.4 million of
cash primarily for the acquisition of Spring Mobile and Simply Mac. During fiscal 2012, we used $139.6 million for capital
expenditures primarily to invest in information systems, distribution center capacity and multichannel, digital and loyalty program
initiatives and to open 146 stores in the U.S. and internationally.
Cash used in financing activities was $131.2 million in fiscal 2014, $350.6 million in fiscal 2013 and $498.5 million in fiscal
2012. The cash flows used in financing activities in fiscal 2014 were primarily for the repurchase of $331.1 million of treasury
shares and the payment of dividends on our Class ACommonStock of $148.8 million, offset in part by the $350.0 million issuance