GameStop 2014 Annual Report Download - page 8
Download and view the complete annual report
Please find page 8 of the 2014 GameStop annual report below. You can navigate through the pages in the report by either clicking on the pages listed below, or by using the keyword search tool below to find specific information within the annual report.-
 1
1 -
 2
2 -
 3
3 -
 4
4 -
 5
5 -
 6
6 -
 7
7 -
 8
8 -
 9
9 -
 10
10 -
 11
11 -
 12
12 -
 13
13 -
 14
14 -
 15
15 -
 16
16 -
 17
17 -
 18
18 -
 19
19 -
20
-
21
-
22
-
23
-
24
-
25
-
26
-
27
-
28
-
29
-
30
-
31
-
32
-
33
-
34
-
35
-
36
-
37
-
38
-
39
-
40
-
41
-
42
-
43
-
44
-
45
-
46
-
47
-
48
-
49
-
50
-
51
-
52
-
53
-
54
-
55
-
56
-
57
-
58
-
59
-
60
-
61
-
62
-
63
-
64
-
65
-
66
-
67
-
68
-
69
-
70
-
71
-
72
-
73
-
74
-
75
-
76
-
77
-
78
-
79
-
80
-
81
-
82
-
83
-
84
-
85
-
86
-
87
-
88
-
89
-
90
-
91
-
92
-
93
-
94
-
95
-
96
-
97
-
98
-
99
-
100
-
101
-
102
-
103
-
104
-
105
-
106
-
107
-
108
-
109
-
110
-
111
-
112
-
113
-
114
 |
 |

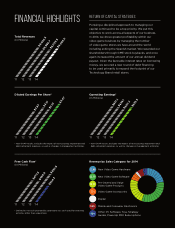
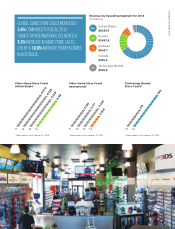
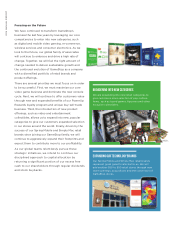
Pre-Owned / Value Video Games
(In Millions)
’11 ’12 ’13 ’14
$2,620.2
$2,430.5
$2,329.8
$2,389.3
MAXIMIZING LEADERSHIP POSITION IN GLOBAL
VIDEO GAME CATEGORY — PRE-OWNED BUSINESS
Increasing Customer Value
Our one-of-a-kind pre-owned business makes it more
affordable for customers to purchase the hottest
video game hardware and software, as well as the
most popular older video game titles (e.g., Call of
Duty Black Ops 2, Grand Theft Auto V, Halo 4,
and Battlefield 3). Through our successful trade-in
program we gave gaming fans around the world
more than $1 billion in trade credits, with more than
70% of those credits applied to the purchase of new
products. To make trading in video game products
even easier for customers, we simplified our trade
pricing structure in August 2014. This change helped
us increase the amount of trades we received by
20%, giving customers more currency to spend in
our stores, ultimately helping our pre-owned and
value products business grow 2.6% for the year. We
also saw our pre-owned accessories business grow
EB Games Australia
generated more than
$20 million in revenue
by offering customers
an expanded range of
collectible video game
and entertainment
products.
6
2014 ANNUAL REPORT