GameStop 2014 Annual Report Download - page 7
Download and view the complete annual report
Please find page 7 of the 2014 GameStop annual report below. You can navigate through the pages in the report by either clicking on the pages listed below, or by using the keyword search tool below to find specific information within the annual report.-
 1
1 -
 2
2 -
 3
3 -
 4
4 -
 5
5 -
 6
6 -
 7
7 -
 8
8 -
 9
9 -
 10
10 -
 11
11 -
 12
12 -
 13
13 -
 14
14 -
 15
15 -
 16
16 -
 17
17 -
 18
18 -
19
-
20
-
21
-
22
-
23
-
24
-
25
-
26
-
27
-
28
-
29
-
30
-
31
-
32
-
33
-
34
-
35
-
36
-
37
-
38
-
39
-
40
-
41
-
42
-
43
-
44
-
45
-
46
-
47
-
48
-
49
-
50
-
51
-
52
-
53
-
54
-
55
-
56
-
57
-
58
-
59
-
60
-
61
-
62
-
63
-
64
-
65
-
66
-
67
-
68
-
69
-
70
-
71
-
72
-
73
-
74
-
75
-
76
-
77
-
78
-
79
-
80
-
81
-
82
-
83
-
84
-
85
-
86
-
87
-
88
-
89
-
90
-
91
-
92
-
93
-
94
-
95
-
96
-
97
-
98
-
99
-
100
-
101
-
102
-
103
-
104
-
105
-
106
-
107
-
108
-
109
-
110
-
111
-
112
-
113
-
114
 |
 |
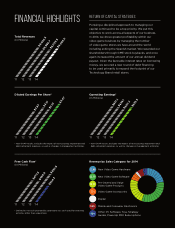
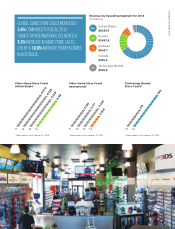
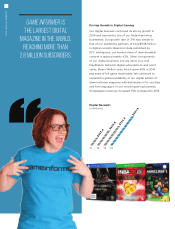
global same store sales increased
3.4% compared to fiscal 2013.
GameStop International delivered a
5.3% increase in same store sales,
led by a 10.6% increase from EB Games
in Australia.
Revenue by Operating Segment for 2014
(In Millions)
United States
$6,193.5
Europe
$1,652.8
Australia
$644.7
Canada
$476.4
Technology Brands
$328.6
66%
18%
7%
5%
4%
Video Game Store Count
International*
’11 ’12 ’13 ’14
2,180
2,177
2,208
2,068
* Store counts as of January 31, 2015
Technology Brands
Store Count*
’13 ’14
218
484
* Store counts as of January 31, 2015
Video Game Store Count
United States*
’11 ’12 ’13 ’14
4,503
4,425
4,249
4,138
* Store counts as of January 31, 2015
5
2014 ANNUAL REPORT