GameStop 2014 Annual Report Download - page 105
Download and view the complete annual report
Please find page 105 of the 2014 GameStop annual report below. You can navigate through the pages in the report by either clicking on the pages listed below, or by using the keyword search tool below to find specific information within the annual report.-
 1
1 -
2
-
3
-
4
-
5
-
6
-
7
-
8
-
9
-
10
-
11
-
12
-
13
-
14
-
15
-
16
-
17
-
18
-
19
-
20
-
21
-
22
-
23
-
24
-
25
-
26
-
27
-
28
-
29
-
30
-
31
-
32
-
33
-
34
-
35
-
36
-
37
-
38
-
39
-
40
-
41
-
42
-
43
-
44
-
45
-
46
-
47
-
48
-
49
-
50
-
51
-
52
-
53
-
54
-
55
-
56
-
57
-
58
-
59
-
60
-
61
-
62
-
63
-
64
-
65
-
66
-
67
-
68
-
69
-
70
-
71
-
72
-
73
-
74
-
75
-
76
-
77
-
78
-
79
-
80
-
81
-
82
-
83
-
84
-
85
-
86
-
87
-
88
-
89
-
90
-
91
-
92
-
93
-
94
-
 95
95 -
 96
96 -
 97
97 -
 98
98 -
 99
99 -
 100
100 -
 101
101 -
 102
102 -
 103
103 -
 104
104 -
 105
105 -
 106
106 -
 107
107 -
 108
108 -
 109
109 -
 110
110 -
 111
111 -
 112
112 -
 113
113 -
 114
114
 |
 |

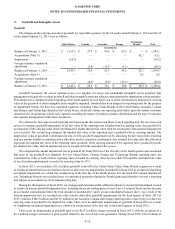
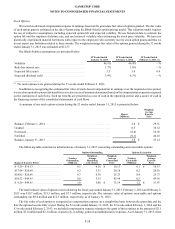
Stock Options
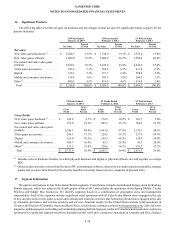
We record stock-based compensation expense in earnings based on the grant-date fair value of options granted. The fair value
of each option grant is estimated on the date of grant using the Black-Scholes option pricing model. This valuation model requires
the use of subjective assumptions, including expected option life and expected volatility.Weuse historical data to estimate the
option life and the employee forfeiture rate, and use historical volatility when estimating the stock price volatility.Wehavenot
historically experienced material forfeitures with respect to the employees who currently receive stock option grants and thus we
do not expect any forfeitures related to these awards. The weighted-average fair value of the options granted during the 52 weeks
ended January 31, 2015 was estimated at $12.37.
Our Black-Scholes assumptionsare presented below:
52 Weeks Ended
January 31, 2015
52 Weeks Ended
February 1, 2014
53 Weeks Ended
February 2, 2013 (1)
Vo latility ................................................................................... 46.5% 46.4%—%
Risk-free interest rate ............................................................... 1.7% 1.0% —%
Expected life (years)................................................................. 5.55.6 0.0
Expected dividend yield ........................................................... 3.4% 4.3% —%
___________________
(1) No stock options were granted during the 53 weeks ended February 2, 2013.
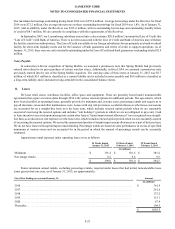
In addition to recognizing the estimated fair value of stock-based compensation in earnings over the required service period,
we are also required to present tax benefits received in excess of amounts determined based on the compensation expense recognized
on the statements of cash flows. Such tax benefits are presented as ause of cash in the operating section and asourceofcash in
the financing section of the consolidated statements of cash flows.
Asummary of our stock option activity during the 52 weeks ended January 31, 2015 is presented below:
Shares
(Millions)
Weighted-
Average
Exercise
Price
Balance, February 1, 2014 ........................................................................................... 2.0$ 29.31
Granted......................................................................................................................... 0.338.52
Exercised...................................................................................................................... (0.4) 16.58
Forfeited....................................................................................................................... (0.1) 46.10
Balance, January 31, 2015 ........................................................................................... 1.8$ 33.14
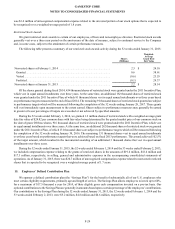
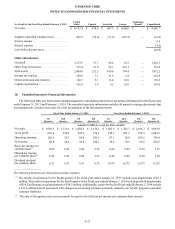
The following table summarizes information as of January 31, 2015 concerning outstanding and exercisable options:
Options Outstanding Options Exercisable
Range of Exercise Prices
Number
Outstanding
(Millions)
Weighted-
Average
Remaining
Life (Years)
Weighted-
Average
Contractual
Price
Number
Exercisable
(Millions)
Weighted-
Average
Exercise
Price
$9.29 -$10.13 ....................................... 0.10.10 $10.13 0.1$ 10.13
$17.94 -$20.69 ....................................... 0.23.1120.18 0.220.18
$24.82 -$26.68 ....................................... 0.76.38 25.33 0.4 25.73
$38.52 -$49.95 ....................................... 0.85.13 45.98 0.5 49.95
$9.29 -$49.95 ....................................... 1.85.08 $33.14 1.2$ 33.97
The total intrinsic value of options exercised during the fiscal years ended January 31, 2015, February 1, 2014 and February 2,
2013 was $10.7 million, $53.5 million, and $7.7 million, respectively.The intrinsic value of options exercisable and options
outstanding was $9.4 million and $12.5 million, respectively,asofJanuary 31, 2015.
The fair value of each option is recognized as compensation expense on astraight-line basis between the grant date and the
date the options become fully vested. During the 52 weeks ended January 31, 2015, the 52 weeks ended February 1, 2014 and the
53 weeks ended February 2, 2013, we included compensation expense relating to the grant of these options in the amount of $2.1
million, $1.0 million and $2.1 million, respectively,inselling, general and administrative expenses. As of January 31, 2015, there
GAMESTOP CORP.
NOTES TO CONSOLIDATED FINANCIAL STATEMENTS
F-28