GameStop 2014 Annual Report Download - page 109
Download and view the complete annual report
Please find page 109 of the 2014 GameStop annual report below. You can navigate through the pages in the report by either clicking on the pages listed below, or by using the keyword search tool below to find specific information within the annual report.-
 1
1 -
2
-
3
-
4
-
5
-
6
-
7
-
8
-
9
-
10
-
11
-
12
-
13
-
14
-
15
-
16
-
17
-
18
-
19
-
20
-
21
-
22
-
23
-
24
-
25
-
26
-
27
-
28
-
29
-
30
-
31
-
32
-
33
-
34
-
35
-
36
-
37
-
38
-
39
-
40
-
41
-
42
-
43
-
44
-
45
-
46
-
47
-
48
-
49
-
50
-
51
-
52
-
53
-
54
-
55
-
56
-
57
-
58
-
59
-
60
-
61
-
62
-
63
-
64
-
65
-
66
-
67
-
68
-
69
-
70
-
71
-
72
-
73
-
74
-
75
-
76
-
77
-
78
-
79
-
80
-
81
-
82
-
83
-
84
-
85
-
86
-
87
-
88
-
89
-
90
-
91
-
92
-
93
-
94
-
95
-
96
-
97
-
98
-
 99
99 -
 100
100 -
 101
101 -
 102
102 -
 103
103 -
 104
104 -
 105
105 -
 106
106 -
 107
107 -
 108
108 -
 109
109 -
 110
110 -
 111
111 -
 112
112 -
 113
113 -
 114
114
 |
 |

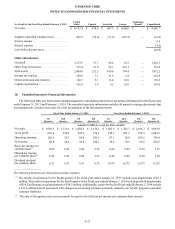
As of and for the Fiscal Year Ended February 2, 2013
United
States Canada Australia Europe
Technology
Brands Consolidated
Net sales........................................................... $6,192.4 $478.4 $607.3 $1,608.6 $—$8,886.7
Segment operating earnings (loss)................... 501.9(74.4)(71.6)(397.5) —(41.6)
Interest income ................................................ 0.9
Interest expense ............................................... (4.2)
Loss before income taxes ................................ (44.9)
Other Information:
Goodwill .......................................................... 1,153.537.796.695.3—1,383.1
Other long-lived assets .................................... 375.421.052.1291.1 —739.6
Total assets....................................................... 2,404.0252.2 416.6799.4 —3,872.2
Income tax expense ......................................... 199.87.1 11.6 6.4 —224.9
Depreciation and amortization ........................ 120.75.1 13.8 36.9 —176.5
Capital expenditures ........................................ 101.83.6 9.225.0—139.6
GAMESTOP CORP.
NOTES TO CONSOLIDATED FINANCIAL STATEMENTS
F-32
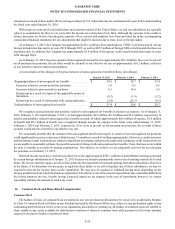
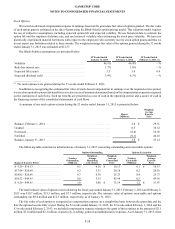
18. Unaudited QuarterlyFinancial Information
The following table sets forth certain unaudited quarterly consolidated statement of operations information for the fiscal years
ended January 31, 2015 and February 1, 2014. The unaudited quarterly information includes all normal recurring adjustments that
our management considers necessary for afair presentation of the information shown.
Fiscal Year Ended January 31, 2015 Fiscal Year Ended February 1, 2014
1st
Quarter
2nd
Quarter
3rd
Quarter
4th
Quarter (1)
1st
Quarter
2nd
Quarter
3rd
Quarter
4th
Quarter (1)
(Amounts in millions, except per shareamounts)
Net sales ................... $1,996.3 $1,731.4 $2,092.2 $3,476.1 $1,865.3 $1,383.7 $2,106.7 $3,683.8
Gross profit............... 626.4550.9 622.2976.4 578.3481.3 598.31,003.2
Operating earnings ... 105.936.789.8385.9 87.2 18.8 109.1358.4
Net income ............... 68.0 24.6 56.4 244.154.610.568.6220.5
Basic net income per
common share(2) ....... 0.59 0.22 0.50 2.25 0.46 0.09 0.59 1.91
Diluted net income
per common share(2) .0.59 0.22 0.50 2.23 0.46 0.09 0.58 1.89
Dividend declared
per common share .... 0.33 0.33 0.33 0.33 0.2750.275 0.2750.275
___________________
The following footnotes are discussed as pretax expenses.
(1) The results of operations for the fourth quarter of the fiscal year ended January 31, 2015 include asset impairments of $2.2
million. The results of operations for the fourth quarter of the fiscal year ended February 1, 2014 include goodwill impairments
of $10.2 million and asset impairments of $18.5 million.Additionally,results for the fiscal year ended February 1, 2014 include
a$33.6 million benefit associated with changes in accounting estimates primarily related to our loyalty programs and other
customer liabilities.
(2) The sum of the quartersmay notnecessarily be equal to the full year net income per common share amount.