GameStop 2014 Annual Report Download - page 65
Download and view the complete annual report
Please find page 65 of the 2014 GameStop annual report below. You can navigate through the pages in the report by either clicking on the pages listed below, or by using the keyword search tool below to find specific information within the annual report.-
 1
1 -
2
-
3
-
4
-
5
-
6
-
7
-
8
-
9
-
10
-
11
-
12
-
13
-
14
-
15
-
16
-
17
-
18
-
19
-
20
-
21
-
22
-
23
-
24
-
25
-
26
-
27
-
28
-
29
-
30
-
31
-
32
-
33
-
34
-
35
-
36
-
37
-
38
-
39
-
40
-
41
-
42
-
43
-
44
-
45
-
46
-
47
-
48
-
49
-
50
-
51
-
52
-
53
-
54
-
 55
55 -
 56
56 -
 57
57 -
 58
58 -
 59
59 -
 60
60 -
 61
61 -
 62
62 -
 63
63 -
 64
64 -
 65
65 -
 66
66 -
 67
67 -
 68
68 -
 69
69 -
 70
70 -
 71
71 -
 72
72 -
 73
73 -
 74
74 -
 75
75 -
76
-
77
-
78
-
79
-
80
-
81
-
82
-
83
-
84
-
85
-
86
-
87
-
88
-
89
-
90
-
91
-
92
-
93
-
94
-
95
-
96
-
97
-
98
-
99
-
100
-
101
-
102
-
103
-
104
-
105
-
106
-
107
-
108
-
109
-
110
-
111
-
112
-
113
-
114
 |
 |

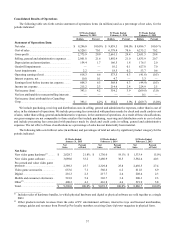
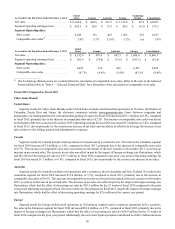
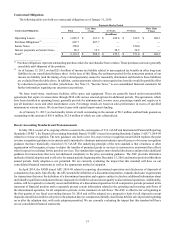
As of and for the Fiscal Year Ended February 1, 2014
United
States Canada Australia Europe
Technology
Brands Consolidated
Net sales .......................................................... $6,160.4 $468.8 $613.7 $1,733.8 $62.8 $9,039.5
Segment operating earnings(loss) .................. $465.3 $26.6 $37.5 $44.3 $(0.2)$ 573.5
Segment Operating data:
Store count .................................................... 4,249335 4181,455 2186,675
Comparable store sales(1) .............................. 3.0% 5.7% 12.6% 3.2% n/a3.8%
As of and for the Fiscal Year Ended February 2, 2013
United
States Canada Australia Europe Consolidated
Net sales .......................................................... $6,192.4 $478.4 $607.3 $1,608.6 $8,886.7
Segment operating earnings(loss) .................. $501.9 $(74.4)$ (71.6)$(397.5)$ (41.6)
Segment Operating data:
Store count .................................................... 4,425336 4161,425 6,602
Comparable store sales ................................. (8.7)% (4.6)% (2.4)% (8.3)% (8.0)%
___________________
(1) Our Technology Brands stores are excluded from the calculation of comparable store sales. Refer to the note to the Selected
Financial Data table in "Item 6—Selected Financial Data" for adiscussion of the calculation of comparable store sales.
Fiscal 2014 Compared to Fiscal 2013
Video Game Brands
United States
Segment results for VideoGameBrandsinthe United States include retail GameStop operations in 50 states, the District of
Columbia, Puerto Rico and Guam, the electronic commerce website www.gamestop.com,Game Informer magazine and
Kongregate, our leading platform for web and mobile gaming. Net sales for fiscal 2014 increased $33.1 million, or 0.5%, compared
to fiscal 2013, primarily due to the increase in comparable store sales of 2.5%. This increase in comparable store sales was driven
by the launch of the new consoles in November 2013. Operating earnings for fiscal 2014 increased $17.9 million, or 3.8%, compared
to fiscal 2013, driven primarily by the current year increase in net sales and our ability to effectively leverage the increase in net
sales relative to theselling, general and administrative expenses.
Canada
Segment results for Canada include retail operations in Canada and an e-commerce site. Net sales in the Canadian segment
for fiscal 2014 increased $7.6 million, or 1.6%, compared to fiscal 2013, primarily due to the increase in comparable store sales
of 9.3%. This increase in comparable store sales was driven by the launch of the new consoles in November 2013, as well as an
increase in pre-owned sales. The increase in net sales was offset in part by the impact of foreign exchange rate fluctuations, which
had the effect of decreasing net sales by $35.7 million in fiscal 2014 compared to the prior year period. Operating earnings for
fiscal 2014 increased $1.7 million, or 6.4%, compared to fiscal 2013, driven primarily by the current year increase in net sales.
Australia
Segment results for Australia include retail operations and e-commerce sites in Australia and New Zealand. Net sales in the
Australian segment for fiscal 2014 increased $31.0 million, or 5.1%, compared to fiscal 2013, primarily due to the increase in
comparable store sales of 10.6%. This increase in comparable store sales was driven by the launch of the new consoles in November
2013, as well as an increase in pre-owned sales. The increase in net sales was offset in part by the impact of foreign exchange rate
fluctuations, which had the effect of decreasing net sales by $39.3 million for the 52 weeks of fiscal 2014 compared to the prior
year period. Operating earnings for fiscal 2014 were relatively flat compared to fiscal 2013, despite the impact of foreign exchange
rate fluctuations, which had the effect of decreasing operatingearningsby$2.6million in the current year period.
Europe
Segment results for Europe include retail operations in 10 Europeancountries ande-commerce operations in five countries.
Net sales in the European segment for fiscal 2014 decreased $81.0 million, or 4.7%, compared to fiscal 2013, primarily due to the
impact of foreign exchange rate fluctuations, which had the effect of decreasing net sales by $58.9 million for the 52 weeks of
fiscal 2014 compared to the prior year period. Additionally,the exit of our Spain operations contributed to a$40.1 million decrease
46