GameStop 2014 Annual Report Download - page 57
Download and view the complete annual report
Please find page 57 of the 2014 GameStop annual report below. You can navigate through the pages in the report by either clicking on the pages listed below, or by using the keyword search tool below to find specific information within the annual report.-
 1
1 -
2
-
3
-
4
-
5
-
6
-
7
-
8
-
9
-
10
-
11
-
12
-
13
-
14
-
15
-
16
-
17
-
18
-
19
-
20
-
21
-
22
-
23
-
24
-
25
-
26
-
27
-
28
-
29
-
30
-
31
-
32
-
33
-
34
-
35
-
36
-
37
-
38
-
39
-
40
-
41
-
42
-
43
-
44
-
45
-
46
-
 47
47 -
 48
48 -
 49
49 -
 50
50 -
 51
51 -
 52
52 -
 53
53 -
 54
54 -
 55
55 -
 56
56 -
 57
57 -
 58
58 -
 59
59 -
 60
60 -
 61
61 -
 62
62 -
 63
63 -
 64
64 -
 65
65 -
 66
66 -
 67
67 -
68
-
69
-
70
-
71
-
72
-
73
-
74
-
75
-
76
-
77
-
78
-
79
-
80
-
81
-
82
-
83
-
84
-
85
-
86
-
87
-
88
-
89
-
90
-
91
-
92
-
93
-
94
-
95
-
96
-
97
-
98
-
99
-
100
-
101
-
102
-
103
-
104
-
105
-
106
-
107
-
108
-
109
-
110
-
111
-
112
-
113
-
114
 |
 |

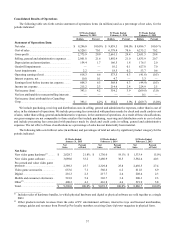
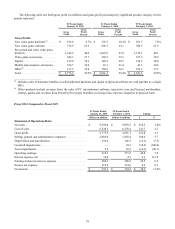
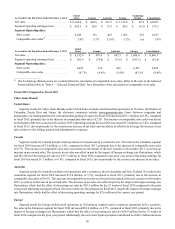
The following table sets forth gross profit (in millions) and gross profit percentages by significant product category for the
periods indicated:
52 Weeks Ended
January 31, 2015
52 Weeks Ended
February 1, 2014
53 Weeks Ended
February 2, 2013
Gross
Profit
Gross
Profit
Percent
Gross
Profit
Gross
Profit
Percent
Gross
Profit
Gross
Profit
Percent
Gross Profit:
New video game hardware(1) ........... $196.6 9.7% $176.5 10.2% $101.7 7.6%
New video game software................ 716.923.2805.3 23.1 786.321.9
Pre-owned and valuevideo game
products............................................ 1,146.348.01,093.9 47.0 1,170.1 48.1
Video game accessories ................... 246.137.7220.5 39.3 237.9 38.9
Digital .............................................. 152.070.3149.2 68.5 120.9 58.0
Mobile and consumerelectronics .... 186.736.065.121.441.320.6
Other(2) ............................................. 131.332.8150.6 36.1 193.3 37.2
Total ................................................. $2,775.9 29.9%$ 2,661.129.4% $2,651.5 29.8%
___________________
(1) Includes sales of hardware bundles, in which physical hardware and digital or physical software are sold together as asingle
SKU.
(2) Other products include revenues from the sales of PC entertainment software, interactive toys and licensed merchandise,
strategy guides and revenues from PowerUp Pro loyalty members receiving Game Informer magazine in physical form.
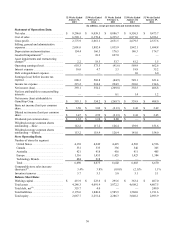
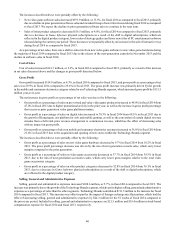
Fiscal 2014 Compared to Fiscal 2013
52 Weeks Ended
January 31, 2015
52 Weeks Ended
February 1, 2014 Change
Dollars in millions Dollars in millions $%
Statement of Operations Data:
Net sales .................................................................................... $9,296.0 $9,039.5 $256.5 2.8%
Cost of sales .............................................................................. 6,520.16,378.4 141.7 2.2
Gross profit ............................................................................... 2,775.92,661.1 114.84.3
Selling, general and administrative expenses ........................... 2,001.01,892.4 108.6 5.7
Depreciation and amortization .................................................. 154.4166.5 (12.1) (7.3)
Goodwill impairments............................................................... —10.2(10.2)(100.0)
Asset impairments..................................................................... 2.218.5(16.3)(88.1)
Operating earnings .................................................................... 618.3573.5 44.8 7.8
Interest expense, net.................................................................. 10.0 4.7 5.3 112.8
Earnings before income tax expense......................................... 608.3568.8 39.5 6.9
Income tax expense................................................................... 215.2214.6 0.60.3
Net income ................................................................................ $393.1 $354.2 $38.911.0%
38