GameStop 2014 Annual Report Download - page 49
Download and view the complete annual report
Please find page 49 of the 2014 GameStop annual report below. You can navigate through the pages in the report by either clicking on the pages listed below, or by using the keyword search tool below to find specific information within the annual report.-
 1
1 -
2
-
3
-
4
-
5
-
6
-
7
-
8
-
9
-
10
-
11
-
12
-
13
-
14
-
15
-
16
-
17
-
18
-
19
-
20
-
21
-
22
-
23
-
24
-
25
-
26
-
27
-
28
-
29
-
30
-
31
-
32
-
33
-
34
-
35
-
36
-
37
-
38
-
 39
39 -
 40
40 -
 41
41 -
 42
42 -
 43
43 -
 44
44 -
 45
45 -
 46
46 -
 47
47 -
 48
48 -
 49
49 -
 50
50 -
 51
51 -
 52
52 -
 53
53 -
 54
54 -
 55
55 -
 56
56 -
 57
57 -
 58
58 -
 59
59 -
60
-
61
-
62
-
63
-
64
-
65
-
66
-
67
-
68
-
69
-
70
-
71
-
72
-
73
-
74
-
75
-
76
-
77
-
78
-
79
-
80
-
81
-
82
-
83
-
84
-
85
-
86
-
87
-
88
-
89
-
90
-
91
-
92
-
93
-
94
-
95
-
96
-
97
-
98
-
99
-
100
-
101
-
102
-
103
-
104
-
105
-
106
-
107
-
108
-
109
-
110
-
111
-
112
-
113
-
114
 |
 |

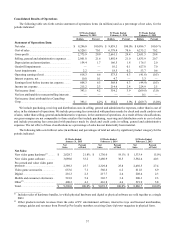
52 Weeks Ended
January 31,
2015
52 Weeks Ended
February 1,
2014
53 Weeks Ended
February 2,
2013
52 Weeks Ended
January 28,
2012
52 Weeks Ended
January 29,
2011
(In millions, except per sharedata and statistical data)
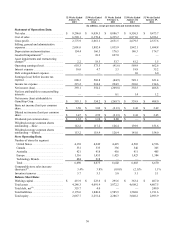
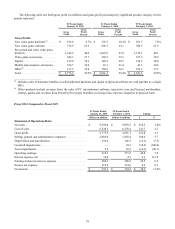
Statement of Operations Data:
Net sales..................................................... $9,296.0 $9,039.5 $8,886.7 $9,550.5 $9,473.7
Cost of sales............................................... 6,520.16,378.4 6,235.2 6,871.0 6,936.1
Gross profit................................................ 2,775.92,661.1 2,651.5 2,679.5 2,537.6
Selling, general and administrative
expenses..................................................... 2,001.01,892.4 1,835.9 1,842.1 1,698.8
Depreciation and amortization .................. 154.4166.5 176.5186.3 174.7
Goodwill impairments(1) ............................ —10.2627.0 ——
Asset impairments andrestructuring
charges(2) .................................................... 2.218.553.781.21.5
Operating earnings (loss)........................... 618.3573.5 (41.6) 569.9662.6
Interest expense ......................................... 10.0 4.7 3.3 19.8 35.2
Debt extinguishmentexpense.................... ———1.0 6.0
Earnings (loss) before income tax
expense ...................................................... 608.3568.8 (44.9)549.1621.4
Income tax expense ................................... 215.2214.6 224.9210.6 214.6
Net income(loss)....................................... 393.1354.2 (269.8)338.5 406.8
Net loss attributable to noncontrolling
interests...................................................... ——0.11.4 1.2
Net income(loss) attributable to
GameStop Corp. ........................................ $393.1 $354.2 $(269.7)$ 339.9 $408.0
Basic net income (loss)per common
share........................................................... $3.50 $3.02 $(2.13)$ 2.43 $2.69
Diluted net income (loss) per common
share........................................................... $3.47 $2.99 $(2.13)$ 2.41 $2.65
Dividends per common share .................... $1.32 $1.10 $0.80 $—$—
Weighted-average common shares
outstanding —basic ................................... 112.2117.2 126.4139.9 151.6
Weighted-average common shares
outstanding —diluted ................................ 113.2118.4 126.4141.0 154.0
StoreOperating Data:
Number of stores by segment
United States ........................................... 4,1384,249 4,425 4,503 4,536
Canada..................................................... 331335 336346 345
Australia .................................................. 421418 416411 405
Europe ..................................................... 1,3161,455 1,425 1,423 1,384
Technology Brands.................................. 484218 —— —
Total......................................................... 6,6906,675 6,602 6,683 6,670
Comparable store salesincrease
(decrease)(3)................................................ 3.4% 3.8% (8.0)% (2.1)% 1.1%
Inventory turnover ..................................... 5.75.3 5.0 5.1 5.1
Balance Sheet Data:
Working capital.......................................... $415.9 $223.6 $295.6 $363.4 $407.0
Total assets................................................. 4,246.34,091.4 3,872.2 4,608.2 4,807.5
Total debt, net(4) ......................................... 355.74.0 ——249.0
Total liabilities ........................................... 2,178.61,840.0 1,585.9 1,568.0 1,911.6
Total equity................................................ 2,067.72,251.4 2,286.3 3,040.2 2,895.9
30