GameStop 2014 Annual Report Download - page 107
Download and view the complete annual report
Please find page 107 of the 2014 GameStop annual report below. You can navigate through the pages in the report by either clicking on the pages listed below, or by using the keyword search tool below to find specific information within the annual report.-
 1
1 -
2
-
3
-
4
-
5
-
6
-
7
-
8
-
9
-
10
-
11
-
12
-
13
-
14
-
15
-
16
-
17
-
18
-
19
-
20
-
21
-
22
-
23
-
24
-
25
-
26
-
27
-
28
-
29
-
30
-
31
-
32
-
33
-
34
-
35
-
36
-
37
-
38
-
39
-
40
-
41
-
42
-
43
-
44
-
45
-
46
-
47
-
48
-
49
-
50
-
51
-
52
-
53
-
54
-
55
-
56
-
57
-
58
-
59
-
60
-
61
-
62
-
63
-
64
-
65
-
66
-
67
-
68
-
69
-
70
-
71
-
72
-
73
-
74
-
75
-
76
-
77
-
78
-
79
-
80
-
81
-
82
-
83
-
84
-
85
-
86
-
87
-
88
-
89
-
90
-
91
-
92
-
93
-
94
-
95
-
96
-
 97
97 -
 98
98 -
 99
99 -
 100
100 -
 101
101 -
 102
102 -
 103
103 -
 104
104 -
 105
105 -
 106
106 -
 107
107 -
 108
108 -
 109
109 -
 110
110 -
 111
111 -
 112
112 -
 113
113 -
 114
114
 |
 |

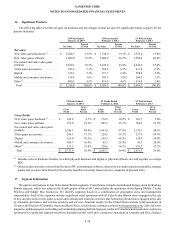
16. Significant Products
The following table sets forth net sales (in millions) and percentages of total net sales by significant product category for the
periods indicated:
52 Weeks Ended
January 31, 2015
52 Weeks Ended
February 1, 2014
53 Weeks Ended
February 2, 2013
Net Sales
Percent
of Total Net Sales
Percent
of Total Net Sales
Percent
of Total
Net sales:
New video game hardware(1) ............. $2,028.7 21.8%$ 1,730.019.1% $1,333.4 15.0%
New video game software.................. 3,089.033.2% 3,480.938.5% 3,582.440.3%
Pre-owned and value video game
products.............................................. 2,389.325.7% 2,329.825.8% 2,430.527.4%
Video game accessories ..................... 653.67.1%560.6 6.2% 611.86.9%
Digital ................................................ 216.32.3%217.7 2.4% 208.42.3%
Mobile and consumer electronics ...... 518.85.6%303.7 3.4% 200.32.3%
Other(2) ............................................... 400.34.3%416.8 4.6% 519.95.8%
Total................................................. $9,296.0 100.0%$ 9,039.5100.0% $8,886.7 100.0%
52 Weeks Ended
January 31, 2015
52 Weeks Ended
February 1, 2014
53 Weeks Ended
February 2, 2013
Gross
Profit
Gross
Profit
Percent
Gross
Profit
Gross
Profit
Percent
Gross
Profit
Gross
Profit
Percent
Gross Profit:
New video game hardware(1) ........... $196.6 9.7%$ 176.510.2% $101.7 7.6%
New video game software................ 716.923.2% 805.323.1% 786.321.9%
Pre-owned andvalue videogame
products............................................ 1,146.348.0%1,093.947.0%1,170.148.1%
Video game accessories ................... 246.137.7% 220.539.3% 237.938.9%
Digital .............................................. 152.070.3% 149.268.5% 120.958.0%
Mobile and consumerelectronics .... 186.736.0% 65.1 21.4%41.320.6%
Other(2) ............................................. 131.332.8% 150.636.1% 193.337.2%
Total............................................... $2,775.9 29.9%$ 2,661.129.4% $2,651.5 29.8%
___________________
(1) Includes sales of hardware bundles, in which physical hardware and digital or physical software are sold together as asingle
SKU.
(2) Other products include revenues from the sales of PC entertainment software, interactive toys and licensed merchandise, strategy
guides and revenues fromPowerUp Pro loyalty members receiving Game Informer magazine in physical form.
GAMESTOP CORP.
NOTES TO CONSOLIDATED FINANCIAL STATEMENTS
F-30
17. Segment Information
We operate our business in four VideoGame Brands segments: United States, Canada, Australia and Europe; and aTechnology
Brands segment, which was added in the fourth quarter of fiscal 2013 and includes the operations of our Spring Mobile, Cricket
Wireless and Simply Mac businesses. We identify segments based on acombination of geographic areas and management
responsibility.Eachofthe segments includes significant retail operations with all VideoGame Brands stores engaged in the sale
of new and pre-owned video game systems and software and related accessories and Technology Brand stores engaged in the sale
of consumer electronics and wireless products and services. Segment results for the United States include retail operations in
50 states, the District of Columbia, Guam and Puerto Rico; our electronic commerce website www.gamestop.com; Game Informer
magazine; and Kongregate, our leading web and mobile gaming platform. Segment results for Canada include retail and e-commerce
operations in Canada and segment results for Australia include retail and e-commerce operations in Australia and New Zealand.