GameStop 2014 Annual Report Download - page 63
Download and view the complete annual report
Please find page 63 of the 2014 GameStop annual report below. You can navigate through the pages in the report by either clicking on the pages listed below, or by using the keyword search tool below to find specific information within the annual report.-
 1
1 -
2
-
3
-
4
-
5
-
6
-
7
-
8
-
9
-
10
-
11
-
12
-
13
-
14
-
15
-
16
-
17
-
18
-
19
-
20
-
21
-
22
-
23
-
24
-
25
-
26
-
27
-
28
-
29
-
30
-
31
-
32
-
33
-
34
-
35
-
36
-
37
-
38
-
39
-
40
-
41
-
42
-
43
-
44
-
45
-
46
-
47
-
48
-
49
-
50
-
51
-
52
-
 53
53 -
 54
54 -
 55
55 -
 56
56 -
 57
57 -
 58
58 -
 59
59 -
 60
60 -
 61
61 -
 62
62 -
 63
63 -
 64
64 -
 65
65 -
 66
66 -
 67
67 -
 68
68 -
 69
69 -
 70
70 -
 71
71 -
 72
72 -
 73
73 -
74
-
75
-
76
-
77
-
78
-
79
-
80
-
81
-
82
-
83
-
84
-
85
-
86
-
87
-
88
-
89
-
90
-
91
-
92
-
93
-
94
-
95
-
96
-
97
-
98
-
99
-
100
-
101
-
102
-
103
-
104
-
105
-
106
-
107
-
108
-
109
-
110
-
111
-
112
-
113
-
114
 |
 |

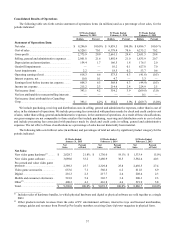
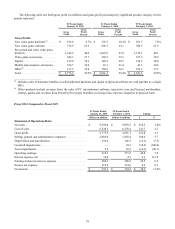
Cost of Sales
Cost of sales increased $143.2 million, or 2.3%, in fiscal 2013 compared to fiscal 2012, primarily as aresultofthe increase
in net sales discussed above and the changes in gross profit discussed below,partially offset by the cost of sales associated with
the 53rd week in fiscal 2012.
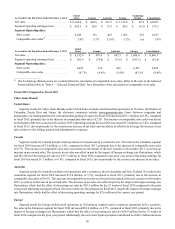
Gross Profit
Gross profit increased $9.6 million, or 0.4%, in fiscal 2013 compared to fiscal 2012, and gross profit as apercentage of net
sales was 29.4% for fiscal 2013 and 29.8% for fiscal 2012. The gross profit percentage decreased primarily due to an increase
in sales of new video game hardware as apercentage of total net sales and the decrease in gross profit as apercentage of sales
on pre-owned and value video game products. This decrease was partially offset by a$33.6 million benefit related to achange
in management estimates on the redemption rate in our PowerUp Rewards and other customer liability programs. In addition,
we recorded an increase in gross profit due to areclassification from selling, general and administrative expenses of cash
consideration received from our vendors to align those funds with the specific products we sell, net of the cost of free or discounted
products for our loyaltyprograms, in the amount of $42.5 million.
The net increase in gross profit as apercentage of net sales was due to the following:
•Gross profit as apercentage of sales on new video game hardware of 10.2% for fiscal 2013 increased from 7.6% for
fiscal 2012 due to the reclassification of cash consideration received from vendors and increased sales of extended
warranties.
•Gross profit as apercentage of sales on new video game software of 23.1% for fiscal 2013 increased from 21.9% for
fiscal 2012 due to the reclassification of cash consideration received from vendors.
•Gross profit as apercentage of sales on digital sales of 68.5% for fiscal 2013 increased from 58.0% for fiscal 2012 due
to conversion of full retail pricerevenue digital currency cards into commission only currency cards.
•Gross profit as apercentage of sales on mobile and consumer electronics revenues of 21.4% for fiscal 2013 increased
from 20.6% for fiscal 2012 due to maturation of the mobile business within the video game stores and due to the newly
acquired Technology Brands stores.
The increases described above were partially offset by the following:
•Gross profit as apercentage of sales on pre-owned and value video game products of 47.0% for fiscal 2013 decreased
from 48.1% for fiscal 2012 due to aggressive trade offers made in the current year in order to provide consumers with
trade currency to help make new consoles more affordable.
•Gross profit as apercentage of sales on the other product sales category of 36.1% for fiscal 2013 declined from 37.2%
for fiscal 2012.
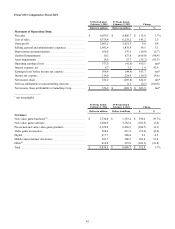
Selling, General and Administrative Expenses
Selling, general and administrative expenses increased $56.5 million, or 3.1%, in fiscal 2013 compared to fiscal 2012. This
increase was primarily due to higher variable costs associated with the increase in comparable store sales during the second half
of 2013 and the net increase in expenses associated with the change in classification of cash consideration received from vendors
and the reclassification of the cost of free or discounted products for our loyalty programs discussed above. These increases were
partially offset by expenses for the 53rd week in fiscal 2012 coupled with changes in foreign exchange rates, which had the effect
of decreasing fiscal 2013 selling, general and administrative expenses by $2.1 million when compared to fiscal 2012.Additionally,
cost control activities during the year associated with the decline in sales at the end of the previous console cycle helped to reduce
our selling, general and administrative expenses along with lower store counts. Selling, general and administrative expenses as
apercentage of sales of 21.0% for fiscal 2013 increased from 20.7% for fiscal 2012, primarily due to the classification of cash
consideration received from vendors and loyalty costs as discussed above. Included in selling, general and administrative expenses
are $19.4 million and $19.6 million in stock-based compensation expense for fiscal 2013and fiscal 2012, respectively.
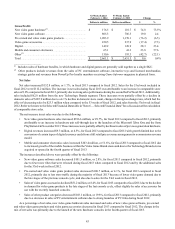
Depreciation and Amortization
Depreciation and amortization expense of $166.5 million for fiscal 2013 decreased $10.0 million from $176.5 million for
fiscal 2012. This decrease was primarily due to adecrease in capital expenditures in recent years when compared to prior years,
which included significant investments in our loyalty and digital initiatives, as well as adecrease in new store openings and
investments in management information systems.
Asset Impairments
During fiscal 2013, we recorded a$28.7 million impairment charge, comprised of a$10.2 million goodwill impairment, a
$7.4 million impairment of technology assets and an impairment of $2.1 million of intangible assets as aresult of our decision
44