GameStop 2014 Annual Report Download - page 2
Download and view the complete annual report
Please find page 2 of the 2014 GameStop annual report below. You can navigate through the pages in the report by either clicking on the pages listed below, or by using the keyword search tool below to find specific information within the annual report.-
 1
1 -
 2
2 -
 3
3 -
 4
4 -
 5
5 -
 6
6 -
 7
7 -
 8
8 -
 9
9 -
 10
10 -
 11
11 -
 12
12 -
 13
13 -
14
-
15
-
16
-
17
-
18
-
19
-
20
-
21
-
22
-
23
-
24
-
25
-
26
-
27
-
28
-
29
-
30
-
31
-
32
-
33
-
34
-
35
-
36
-
37
-
38
-
39
-
40
-
41
-
42
-
43
-
44
-
45
-
46
-
47
-
48
-
49
-
50
-
51
-
52
-
53
-
54
-
55
-
56
-
57
-
58
-
59
-
60
-
61
-
62
-
63
-
64
-
65
-
66
-
67
-
68
-
69
-
70
-
71
-
72
-
73
-
74
-
75
-
76
-
77
-
78
-
79
-
80
-
81
-
82
-
83
-
84
-
85
-
86
-
87
-
88
-
89
-
90
-
91
-
92
-
93
-
94
-
95
-
96
-
97
-
98
-
99
-
100
-
101
-
102
-
103
-
104
-
105
-
106
-
107
-
108
-
109
-
110
-
111
-
112
-
113
-
114
 |
 |

RETURN OF CAPITAL STRATEGIES
Pursuing a disciplined approach to managing our
capital continued to be a top priority. We put this
objective to work across all aspects of our business.
In 2014, we drove greater profitability within our
video game business by managing the number
of video game stores we have around the world
including exiting the Spanish market. We rewarded our
shareholders through GME stock buybacks, and once
again increased the amount of our annual dividend
payout. Given the favorable interest rates on borrowing
money, we secured a new round of debt financing
to be used primarily to expand the footprint of our
Technology Brand retail stores.
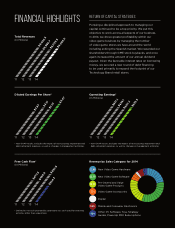
FINANCIAL HIGHLIGHTS
Total Revenues
(In Millions)
’11 ’12 ’13 ’14
$9,550.5
$8,886.7
$9,039.5
$9,296.0
Free Cash Flow*
(In Millions)
’11 ’12 ’13 ’14
$470.3
$459.0
$632.6
$334.3
Revenue by Sales Category for 2014
* Defined as net cash provided by operations less cash used for investing
activities other than acquisitions.
Diluted Earnings Per Share*
’11 ’12 ’13 ’14
$2.87
$3.17
$3.01
$3.47
Operating Earnings*
(In Millions)
’11 ’12 ’13 ’14
$651.1
$639.1
$602.2
$635.3
* Non-GAAP results; excludes the impact of restructuring, impairment and
debt-retirement expenses, as well as changes in management estimates.
* Non-GAAP results; excludes the impact of restructuring, impairment and
debt-retirement expenses, as well as changes in management estimates.
21.8%
33.2%
25.7%
7.1%
2.3%
5.6%
4.3%
New Video Game Hardware
New Video Game Software
Pre-Owned and Value
Video Game Products
Video Game Accessories
Digital
Mobile and Consumer Electronics
Other: PC Software, Toys, Strategy
Guides, PowerUp PRO Subscriptions