GameStop 2014 Annual Report Download - page 64
Download and view the complete annual report
Please find page 64 of the 2014 GameStop annual report below. You can navigate through the pages in the report by either clicking on the pages listed below, or by using the keyword search tool below to find specific information within the annual report.-
 1
1 -
2
-
3
-
4
-
5
-
6
-
7
-
8
-
9
-
10
-
11
-
12
-
13
-
14
-
15
-
16
-
17
-
18
-
19
-
20
-
21
-
22
-
23
-
24
-
25
-
26
-
27
-
28
-
29
-
30
-
31
-
32
-
33
-
34
-
35
-
36
-
37
-
38
-
39
-
40
-
41
-
42
-
43
-
44
-
45
-
46
-
47
-
48
-
49
-
50
-
51
-
52
-
53
-
 54
54 -
 55
55 -
 56
56 -
 57
57 -
 58
58 -
 59
59 -
 60
60 -
 61
61 -
 62
62 -
 63
63 -
 64
64 -
 65
65 -
 66
66 -
 67
67 -
 68
68 -
 69
69 -
 70
70 -
 71
71 -
 72
72 -
 73
73 -
 74
74 -
75
-
76
-
77
-
78
-
79
-
80
-
81
-
82
-
83
-
84
-
85
-
86
-
87
-
88
-
89
-
90
-
91
-
92
-
93
-
94
-
95
-
96
-
97
-
98
-
99
-
100
-
101
-
102
-
103
-
104
-
105
-
106
-
107
-
108
-
109
-
110
-
111
-
112
-
113
-
114
 |
 |

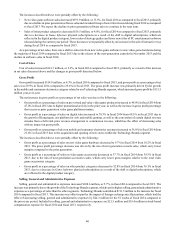
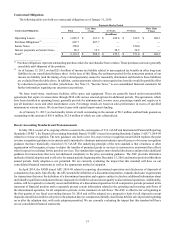
to abandon Spawn Labs. Additionally,werecognized$9.0million of property and equipment impairments during fiscal 2013.
During fiscal 2012, we recorded a$680.7million impairment charge, comprised of $627.0 million of goodwill impairments,
$44.9 million of trade name impairment and $8.8 million of property and equipment impairments. Refer to Note 2, "Asset
Impairments," and Note 9, "Goodwill and Intangible Assets," to the consolidated financial statements in this Form 10-K for
further information associated with these impairments.
Interest Income and Expense
Interest income resulting from the investment of excess cash balances was $0.9 million for both fiscal 2013 and fiscal 2012.
Interest expense of $5.6 million for fiscal 2013 increased from $4.2 million for fiscal 2012, primarily due to increased average
borrowings under our revolving credit facility during the year and interest expense incurred on pre-acquisition indebtedness of
one of the businesses acquired, prior to paying offthe debt during fiscal 2013.
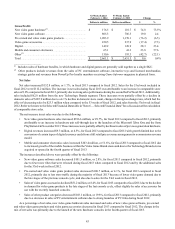
Income Tax
Income tax expense was $214.6 million for fiscal 2013 compared to $224.9 million on a$44.9 million loss before income
tax expense for fiscal 2012. The difference in the effective income tax rate between fiscal 2013 and fiscal 2012 was primarily
due to the recognition of the goodwill impairment charge in fiscal 2012 which is not tax deductible and the recording of valuation
allowances against certain deferred tax assets in the European segment in fiscal 2012. Refer to Note 13, "Income Taxes,"toour
consolidated financial statements for additional information regarding income taxes.
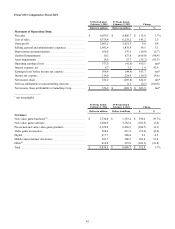
Operating Earnings and Net Income
The factors described above led to operating earnings of $573.5 million for fiscal 2013, an increase of $615.1 million from
an operating loss of $41.6 million during fiscal 2012, and aconsolidated net income of $354.2 million for fiscal 2013, an increase
in consolidated net income of $624.0 million from anet loss of $269.8 million for fiscal 2012. The increase in operating earnings
is primarily attributable to goodwill and asset impairments recognized in fiscal 2012, as discussed more fully above.
45
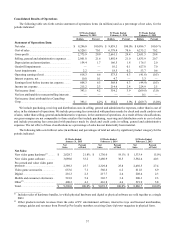
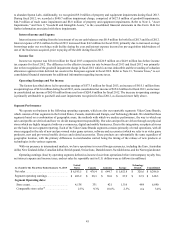
Segment Performance
We operate our business in the following operating segments, which are also our reportable segments: VideoGame Brands,
which consists of four segments in the United States, Canada, Australia and Europe, and Technology Brands. We identified these
segmentsbased on acombination of geographic areas, the methods with which we analyze performance, the way in which our
sales andprofits are derived and how we divide management responsibility.Our sales andprofits are driven through our physical
stores which are highly integrated with our e-commerce, digital and mobile businesses. Due to this integration, our physical stores
are the basis for our segment reporting. Each of the VideoGame Brands segments consists primarily of retail operations, with all
stores engaged in the sale of new and pre-owned video game systems, software and accessories (which we refer to as video game
products), new and pre-owned mobile devices and related accessories. These products are substantially the same regardless of
geographic location, with the primary differences in merchandise carried being the timing of the release of new products or
technologies in the various segments.
With our presence in international markets, we have operations inseveral foreign currencies, including the Euro, Australian
dollar,New Zealand dollar,Canadian dollar,British pound, Swiss franc, Danish kroner,Swedish krona, and the Norwegian kroner.
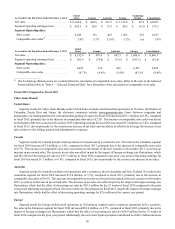
Operating earnings (loss) by operating segment, defined as income (loss) from operations before intercompany royalty fees,
net interest expense and income taxes, and net sales by reportable unit in U.S. dollars were as follows (in millions):
As of and for the Fiscal Year Ended January 31, 2015
United
States Canada Australia Europe
Technology
Brands Consolidated
Net sales........................................................... $6,193.5 $476.4 $644.7 $1,652.8 $328.6 $9,296.0
Segment operating earnings............................. $483.2 $28.3 $38.0 $35.9 $32.9 $618.3
Segment Operating data:
Store count..................................................... 4,138331 4211,316 4846,690
Comparable store sales(1) ............................... 2.5%9.3%10.6%2.3%n/a3.4%